Calculate slope instantly with our fast and accurate Slope Calculator.
Table of Contents
- Introduction
- What Is Probability?
- What Is a Probability Calculator?
- Key Statistical Concepts Behind the Probability Calculator
- Types of Probability Covered by the Probability Calculator
- How to Use the Probability Calculator Step by Step
- Understanding the Results of a Probability Calculator
- Probability Calculator in Education and Academic Research
- Probability Calculator in Finance and Risk Analysis
- Probability Calculator in Medical and Scientific Research
- Probability Calculator in Data Science and Machine Learning
- Binomial Probability and the Probability Calculator
- Z-Score, T-Score, and the Probability Calculator
- Common Mistakes When Using a Probability Calculator
- Benefits of Using an Online Probability Calculator
- Frequently Asked Questions (FAQs)
- Conclusion
Introduction
Mathematics and statistics play a vital role in everyday decision-making, and at the heart of statistical analysis lies one of the most powerful tools available to students, researchers, and professionals — the Probability Calculator. Whether you are trying to determine the likelihood of an event occurring, analyze experimental data, or make informed predictions, the Probability Calculator simplifies complex statistical computations into fast, reliable results. In this in-depth guide, we explore everything about the Probability Calculator — how it works, what formulas it uses, where it is applied, and how to interpret its outputs.
This resource is designed to help beginners and advanced users alike get the most from this essential statistical tool. Read on to discover why the Probability Calculator is an indispensable asset in statistics, science, finance, medicine, and beyond.
What Is Probability?
Probability is the mathematical measure of how likely an event is to occur. It is expressed as a number between 0 and 1, where 0 means the event is impossible and 1 means the event is certain. In everyday language, probability is often expressed as a percentage — for example, a 70% chance of rain means the probability is 0.70.
Probability forms the backbone of statistics, data science, risk assessment, and decision theory. Without a solid understanding of probability, it is impossible to draw meaningful conclusions from data. From predicting stock market movements to assessing the effectiveness of a new drug, probability is woven into nearly every analytical discipline.
The formula for basic probability is:
P(Event) = Number of Favorable Outcomes / Total Number of Possible Outcomes
This simple formula, however, is just the beginning. Modern probability analysis involves far more complex calculations — which is exactly where the Calculator becomes invaluable.
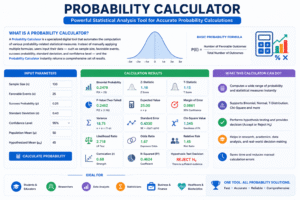
What Is a Probability Calculator?
A Calculator is a specialized digital tool that automates the computation of various probability-related statistical measures. Instead of manually applying multiple formulas, users input their data — such as sample size, favorable events, success probability, standard deviation, and confidence level — and the Probability Calculator instantly returns a comprehensive set of results.
These results typically include:
- Binomial Probability
- Z-Statistic and T-Statistic
- P-Value
- Expected Value
- Margin of Error
- Variance and Standard Error
- Chi-Square Value
- Likelihood Ratio
- Odds Ratio and Relative Risk
- Correlation and R-Squared
- Hypothesis Testing Decision (Accept or Reject H₀)
The Probability Calculator is not just a single-function tool — it is a comprehensive statistical analysis engine that covers a wide range of probability distributions and testing methods, all in one place. Whether you are a student performing a binomial experiment or a data analyst running hypothesis tests, the Calculator has you covered.
Key Statistical Concepts Behind the Probability Calculator
To fully understand and use the Probability Calculator effectively, it helps to be familiar with a few core statistical concepts:
Sample Size (n) The total number of observations or trials in your dataset. A larger sample size generally leads to more reliable results.
Favorable Events (x) The number of outcomes in your sample that match the condition you are testing.
Success Probability (p) and Failure Probability (q) In probability theory, every event has a probability of success (p) and a complementary probability of failure (q), where p + q = 1.
Standard Deviation (σ) A measure of how spread out the values in a dataset are from the mean. The Probability uses this value in Z-tests, T-tests, margin of error, and standard error computations.
Confidence Level The probability that the true population parameter falls within the calculated confidence interval. Common confidence levels are 90%, 95%, and 99%.
Alpha Level (α) The threshold for statistical significance. An alpha of 0.05 means there is a 5% chance of rejecting a true null hypothesis.
Degrees of Freedom A value used in T-tests and Chi-Square tests that accounts for the number of independent values in a calculation.
Types of Probability Covered by the Probability Calculator
The Probability Calculator is a multi-function tool that covers several types of probability calculations:
Binomial Probability Calculates the probability of a specific number of successes in a fixed number of independent trials, each with the same success probability.
Z-Test Probability Used for hypothesis testing with large samples (n > 30) and known population standard deviations. The Probability Calculator computes the Z-Statistic and compares it against the critical value to make a statistical decision.
T-Test Probability Applied when sample sizes are small and the population standard deviation is unknown. The Probability uses the T-Score to determine statistical significance.
Chi-Square Probability Tests the independence of categorical variables or the goodness of fit between observed and expected frequencies.
Geometric Probability Calculates the probability that the first success occurs on a specific trial in a series of independent Bernoulli experiments.
Poisson Probability Estimates the probability of a given number of events occurring in a fixed interval of time or space, based on the Poisson distribution.
How to Use the Probability Calculator Step by Step
Using the Calculator is straightforward even for users with limited statistical experience. Here is a step-by-step guide:
Step 1 — Enter Your Sample Data Input the total sample size (n) and the number of favorable events (x). These are the foundation of most probability calculations.
Step 2 — Set the Probability Parameters Enter the success probability (p) and failure probability (q). Make sure p + q = 1 for accurate results.
Step 3 — Input Additional Statistical Values Fill in your observed mean, population mean, standard deviation, confidence level, alpha level, and degrees of freedom as required for your specific test.
Step 4 — Enter Test Scores (Optional) If you are running a hypothesis test, enter the Z-Score, T-Score, Chi-Square value, effect size, and statistical power to get a full analysis.
Step 5 — Click Calculate Press the “Calculate” button and the Calculator will instantly generate your results — including binomial probability, Z-statistic, P-value, expected value, margin of error, variance, and more.
Step 6 — Review the Statistical Decision The Calculator will display a final decision: Reject H₀ or Accept H₀ based on your Z-Statistic compared to the critical value, helping you conclude your hypothesis test with confidence.
Understanding the Results of a Probability Calculator
The output of a Probability Calculator contains multiple statistical values. Here is what each result means:
| Result | What It Tells You |
|---|---|
| Binomial Probability | Likelihood of exactly x successes in n trials |
| Z-Statistic | Standardized test score for large-sample tests |
| T-Statistic | Test score scaled by sample standard deviation |
| Expected Value | Average outcome predicted by probability theory |
| Margin of Error | Range of uncertainty around an estimate |
| Variance | Measure of data spread around the mean |
| P-Value | Probability of results as extreme as observed, under H₀ |
| R-Squared | Proportion of variance explained by the model |
| Chi-Square | Test statistic for categorical data independence |
| Standard Error | Precision of the sample mean as a population estimate |
| Odds Ratio | Relative likelihood of an event between two groups |
| Decision | Whether to reject or accept the null hypothesis |
Understanding each of these outputs enables you to conduct a thorough, multi-dimensional statistical analysis using a single Probability.
Probability Calculator in Education and Academic Research
Students at every level of education benefit enormously from using a Probability Calculator. In secondary school, students use it to understand basic event probability. In college and graduate school, it becomes a critical tool for statistical coursework, research papers, and experimental analysis.
Professors and educators use the Probability Calculator to design tests, determine grade distributions, and evaluate the statistical significance of student performance data. In academic research, any study that involves hypothesis testing, sampling, or inferential statistics relies on probability calculations — making the Probability Calculator an essential research tool.
For example, a psychology researcher studying the effect of sleep deprivation on reaction time would use the Calculator to run a T-test on their sample data, determine the P-value, and conclude whether their findings are statistically significant.
Probability Calculator in Finance and Risk Analysis
In finance, uncertainty is a constant — and probability is the primary language for quantifying that uncertainty. The Probability Calculator is widely used by financial analysts, investment bankers, actuaries, and risk managers.
Key financial applications include:
- Portfolio Risk Assessment — Using probability distributions to estimate the likelihood of returns falling within certain ranges
- Option Pricing — Black-Scholes and binomial models rely heavily on probability calculations
- Credit Risk Modeling — Banks use the Probability Calculator to estimate the probability of borrower default
- Insurance Actuarial Analysis — Actuaries calculate the probability of claims occurring to set premium rates accurately
The Calculator enables financial professionals to quantify risk precisely, turning vague uncertainty into actionable statistical insights that drive better investment and lending decisions.
Probability Calculator in Medical and Scientific Research
Medical research is built on probability. Every clinical trial, drug efficacy study, and epidemiological investigation depends on calculations to determine whether observed outcomes are genuine effects or mere chance.
The Probability Calculator is used in medicine to:
- Determine statistical significance in drug trials (P-value testing)
- Calculate confidence intervals for treatment outcomes
- Perform Chi-Square tests to assess relationships between patient characteristics and health outcomes
- Evaluate sensitivity and specificity of diagnostic tests through likelihood ratios and odds ratios
In public health, probability models help predict disease spread, estimate vaccination coverage needed for herd immunity, and assess the risk of outbreaks — all using the same fundamental calculations that a Probability Calculator performs.
Probability Calculator in Data Science and Machine Learning
Data science and machine learning are among the fastest-growing fields in the world — and both are deeply rooted in probability theory. Every machine learning model, from logistic regression to neural networks, makes probabilistic predictions.
Data scientists use the Calculator to:
- Validate model assumptions using statistical tests
- Evaluate model performance using metrics derived from probability (AUC-ROC, F1 score, P-values)
- Perform A/B testing to determine whether feature changes produce statistically significant improvements
- Assess feature correlations using R-squared and correlation coefficients
The Probability Calculator accelerates the exploratory data analysis phase, helping data scientists quickly identify significant patterns and relationships before building complex models.
Binomial Probability and the Probability Calculator
One of the most commonly used functions of the Calculator is computing binomial probability. The binomial distribution applies when:
- There are a fixed number of trials (n)
- Each trial has only two outcomes: success or failure
- The probability of success (p) is the same for every trial
- All trials are independent
The binomial probability formula is:
P(x) = pˣ × q^(n−x)
For example, if you flip a fair coin 10 times and want to know the probability of getting exactly 4 heads, the Probability Calculator applies the binomial formula instantly — saving you from complex manual computation.
Binomial probability is used in quality control, genetics, clinical trials, sports analytics, and survey research — any scenario where you count successes in a series of independent trials.
Z-Score, T-Score, and the Probability Calculator
Hypothesis testing — one of the most critical statistical methods — relies on test statistics like the Z-Score and T-Score. The Probability Calculator computes both and compares them against critical values to reach a statistical decision.
Z-Test (Large Samples) When n > 30 and the population standard deviation is known, the Z-Statistic is used:
Z = (Observed Mean − Population Mean) / (Standard Deviation / √n)
T-Test (Small Samples) When n ≤ 30 or population SD is unknown, the T-Statistic provides a more accurate test.
The Calculator automates this entire process — computing the test statistic, comparing it against the critical value at your specified alpha level, and declaring whether to Reject H₀ or Accept H₀. This makes hypothesis testing accessible to users who may not have advanced statistical training.
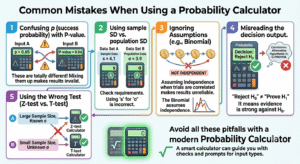
Common Mistakes When Using a Probability Calculator
Even with a powerful Calculator, incorrect inputs lead to incorrect conclusions. Here are the most common mistakes to avoid:
- Confusing p (success probability) with P-value — These are entirely different values; mixing them up produces invalid results
- Using sample standard deviation in place of population standard deviation — Always check which one your test requires
- Ignoring assumptions — The binomial distribution assumes independent trials; violating this assumption makes results unreliable
- Misreading the decision output — “Reject H₀” does not prove the alternative hypothesis; it simply indicates that the evidence against H₀ is strong
- Using the wrong test — Always choose between Z-test and T-test based on your sample size and knowledge of population parameters
Benefits of Using an Online Probability Calculator
The advantages of using an online Probability Calculator far outweigh those of manual computation:
Comprehensive Output A single calculation returns binomial probability, Z-statistic, T-statistic, P-value, expected value, margin of error, variance, standard error, Chi-Square, Likelihood Ratio, Geometric Probability, Poisson Lambda, Sample Proportion, Relative Risk, Odds Ratio, F-Statistic, R-Squared, Test Power, Coefficient of Variation, and a hypothesis testing decision — all at once.
Zero Manual Error The Calculator applies every formula with mathematical precision, eliminating the arithmetic mistakes that frequently occur in manual calculation.
Time Efficiency What would take 30 minutes of manual computation is accomplished in under a second with the Probability Calculator.
Accessibility Available online without any software installation, the Probability Calculator works on any browser and any device, anytime.
Educational Value By showing multiple related statistical outputs simultaneously, the Probability Calculator helps users understand the relationships between different statistical concepts — making it an excellent learning tool.
Frequently Asked Questions (FAQs)
What is a Probability Calculator used for? A Probability Calculator is used to compute a wide range of probability and statistical values — including binomial probability, Z-statistics, T-statistics, P-values, margin of error, and hypothesis testing decisions — from a single set of user inputs.
What inputs does the Probability Calculator need? The Probability Calculator typically requires the sample size (n), favorable events (x), success probability (p), failure probability (q), observed mean, population mean, standard deviation, confidence level, alpha level, degrees of freedom, Z-Score, T-Score, Chi-Square value, correlation coefficient, effect size, and statistical power.
What is a P-value and how does the Probability Calculator use it? The P-value is the probability of observing a result as extreme as the actual data, assuming the null hypothesis is true. The Probability Calculator derives the P-value from the alpha level (P-value = 1 − Confidence Level) and uses it to assess statistical significance.
What does “Reject H₀” mean in the Probability Calculator output? When the Probability Calculator outputs “Reject H₀,” it means the computed Z-Statistic exceeds the critical value, indicating that the observed data is statistically unlikely under the null hypothesis. This suggests a statistically significant result.
Can I use the Probability Calculator for both one-tailed and two-tailed tests? Yes. By adjusting the alpha level appropriately, the Probability Calculator can be used for one-tailed tests (testing in one direction) and two-tailed tests (testing both directions). For a two-tailed test at 95% confidence, the critical Z-value is ±1.96.
What is the difference between expected value and observed mean? The observed mean is the actual average from your sample data. The expected value is the theoretical average predicted by probability theory (calculated as n × p). The Probability Calculator computes both.
Is the Probability Calculator suitable for beginners? Absolutely. The Probability Calculator is designed to be intuitive and user-friendly, even for users with no prior statistical training. The input fields are clearly labeled and the outputs are straightforward to interpret.
What is the Odds Ratio in the Probability Calculator? The Odds Ratio compares the odds of an event occurring in one group versus another. It is widely used in medical research and epidemiology. The Probability Calculator computes it as (x/n) / (1 − x/n).
What is Poisson Lambda in the Probability Calculator? Poisson Lambda (λ) is the expected number of events in a given interval, calculated as n × p. It is the key parameter of the Poisson distribution, used to model rare events over time or space.
How accurate is an online Probability Calculator? A properly built Calculator is highly accurate — it applies all formulas exactly as defined by statistical theory, without rounding errors or manual mistakes.
Conclusion
The Probability Calculator is one of the most comprehensive and valuable statistical tools available today. From simple binomial experiments to complex hypothesis testing, from educational research to financial risk modeling, the Probability Calculator delivers fast, accurate, and complete statistical analysis at the click of a button.
In a world increasingly driven by data, the ability to quickly assess probability, statistical significance, and the reliability of outcomes is not just an academic skill — it is a professional necessity. The Probability Calculator democratizes access to advanced statistics, putting the power of rigorous analysis in the hands of students, researchers, analysts, and decision-makers at every level.
Whether you are testing a hypothesis, evaluating a business strategy, analyzing experimental data, or simply trying to understand the likelihood of an outcome, the Probability Calculator is your most reliable statistical partner. Its ability to simultaneously compute over twenty statistical values from a single input set makes it unmatched in efficiency and versatility.
We encourage you to bookmark this guide, explore the Probability Calculator with your own data, and make data-driven decisions with confidence. Statistics is not about guessing — it is about knowing, and the Calculator is the tool that makes knowing possible.