Use the Average Calculator tool for instant, easy, and precise average calculation
Table of Contents
- Introduction
- What Is Standard Deviation?
- What Is a Standard Deviation Calculator?
- The Equation For Standard Deviation — Population Formula
- The Equation For Standard Deviation — Sample Formula
- Population vs. Sample Standard Deviation — When to Use Each
- How to Calculate Standard Deviation Step by Step
- Variance and Its Relationship to the Equation For Standard Deviation
- How to Use the Standard Deviation Calculator
- Understanding the Standard Deviation Calculator’s Output
- Standard Deviation in Education and Grading
- Standard Deviation in Finance and Investment Analysis
- Standard Deviation in Science and Research
- Standard Deviation in Quality Control and Manufacturing
- Standard Deviation in Data Science and Machine Learning
- Interpreting Standard Deviation — What the Number Means
- Common Mistakes with the Equation For Standard Deviation
- Frequently Asked Questions (FAQs)
- Conclusion
Introduction
In statistics, no single measure captures the spread and variability of a dataset more completely than standard deviation. Whether you are analyzing student exam scores, measuring the consistency of a manufacturing process, evaluating investment risk, or comparing the variability of two scientific experiments, the equation for standard deviation is the mathematical tool that makes that analysis possible. It tells you not just where the center of your data lies, but how far your individual data points scatter around that center — providing the full picture of a dataset’s behavior that the mean alone cannot offer.
The equation for standard deviation may look intimidating at first glance, but its logic is straightforward, its interpretation is intuitive, and its applications are universal. In this comprehensive guide, we will break down every component of the equation for standard deviation, walk through manual calculations step by step, explain the critical difference between population and sample formulas, and explore where standard deviation appears across education, science, finance, quality control, and data science. Whether you are a student building a statistical foundation, a researcher reporting experimental results, or a professional making data-driven decisions, this guide will give you a thorough and practical understanding of the equation for standard deviation and the Standard Deviation Calculator that makes it instantly computable.
What Is Standard Deviation?
Standard deviation is a statistical measure that quantifies the amount of variation or dispersion in a set of data values. A low standard deviation means data points are clustered closely around the mean; a high standard deviation means data points are spread over a wide range.
Conceptually, standard deviation answers the question: “On average, how far is each data point from the mean of the dataset?”
Simple illustration:
- Dataset A: 50, 50, 50, 50, 50 → Mean = 50, SD = 0 (no variation — all values are identical)
- Dataset B: 40, 45, 50, 55, 60 → Mean = 50, SD ≈ 7.91 (moderate spread around the mean)
- Dataset C: 10, 30, 50, 70, 90 → Mean = 50, SD ≈ 31.62 (wide spread around the mean)
Standard deviation is always non-negative (zero only when all values are identical) and is expressed in the same units as the original data — making it directly interpretable in context.
Standard deviation is used everywhere:
- In education, to understand how spread out student scores are around the class average
- In finance, as the primary measure of investment volatility and risk
- In science, to express the precision of measurements and experimental results
- In quality control, to monitor whether a manufacturing process stays within specifications
- In data science, as a component of normalization, anomaly detection, and model evaluation
Understanding the equation for standard deviation is the key to unlocking all of these applications.
What Is a Standard Deviation Calculator?
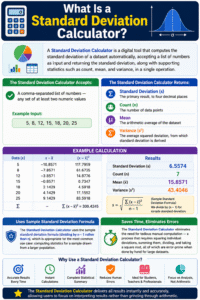
A Standard Deviation Calculator is a digital tool that computes the standard deviation of a dataset automatically, accepting a list of numbers as input and returning the standard deviation, along with supporting statistics such as count, mean, and variance, in a single operation.
The Standard Deviation Calculator accepts:
- A comma-separated list of numbers — any set of at least two numeric values
The Standard Deviation Calculator returns:
- Standard Deviation (s) — the primary result, to four decimal places
- Count (n) — the number of data points
- Mean — the arithmetic average of the dataset
- Variance (s²) — the average squared deviation, from which standard deviation is derived
The Standard Deviation Calculator uses the sample standard deviation formula (dividing by n − 1 rather than n), which is appropriate for the most common use case: computing statistics for a sample drawn from a larger population.
The Standard Deviation Calculator eliminates the need for tedious manual computation — a process that requires squaring individual deviations, summing them, dividing, and taking a square root, all of which are error-prone when done by hand for large datasets. By delivering all results instantly and accurately, the Standard Deviation Calculator allows users to focus on interpreting results rather than grinding through arithmetic.
The Equation For Standard Deviation — Population Formula
The population standard deviation formula is used when your dataset represents the entire population — every member of the group you are studying.
Population Standard Deviation Formula:
σ = √[ Σ(xᵢ − μ)² / N ]
Where:
- σ (sigma) = population standard deviation
- Σ = sum of (add up all the following terms)
- xᵢ = each individual data point
- μ (mu) = population mean = Σxᵢ / N
- N = total number of data points in the population
Breaking down the equation for standard deviation (population):
- Compute the mean μ — sum all values and divide by N
- Find each deviation (xᵢ − μ) — how far each point is from the mean (can be positive or negative)
- Square each deviation (xᵢ − μ)² — squaring eliminates negatives and amplifies larger deviations
- Sum all squared deviations Σ(xᵢ − μ)² — total spread across all data points
- Divide by N — average squared deviation (this is the population variance, σ²)
- Take the square root √ — converts variance back to original units
The population formula (dividing by N) gives the exact standard deviation for the complete dataset you have measured.
The Equation For Standard Deviation — Sample Formula
The sample standard deviation formula is used when your dataset is a sample drawn from a larger population, and you want to estimate the standard deviation of that larger population.
Sample Standard Deviation Formula:
s = √[ Σ(xᵢ − x̄)² / (n − 1) ]
Where:
- s = sample standard deviation
- Σ = sum of all terms
- xᵢ = each individual data point
- x̄ (x-bar) = sample mean = Σxᵢ / n
- n = number of data points in the sample
- (n − 1) = Bessel’s correction factor
The critical difference: The sample formula divides by (n − 1) instead of N.
Why (n − 1)? When estimating the population standard deviation from a sample, dividing by n tends to underestimate the true population spread — because a sample, by chance, tends to be slightly less spread out than the full population. Dividing by (n − 1) instead — Bessel’s correction — removes this bias and produces an unbiased estimate of the population standard deviation. The Standard Deviation Calculator uses this sample formula (n − 1), which is appropriate for the vast majority of practical statistical applications.
The equation for standard deviation in sample form is the most widely used version in statistics courses, research papers, business analysis, and scientific reporting.
Population vs. Sample Standard Deviation — When to Use Each
Choosing between the population and sample versions of the equation for standard deviation is one of the most important decisions in applied statistics.
Use the population formula (σ, divide by N) when:
- Your dataset contains every member of the group you are studying
- Examples: all students in a single class, all products in a single batch, all temperatures recorded in a specific day
Use the sample formula (s, divide by n − 1) when:
- Your dataset is a subset drawn from a larger group, and you want to make inferences about that larger group
- Examples: 500 survey respondents out of millions of customers, 30 test samples from a production run of thousands, a week of stock prices used to estimate annual volatility
The practical rule: If in doubt, use the sample formula (n − 1). The Standard Deviation Calculator implements the sample formula — the correct choice for most analytical contexts where data is collected from a subset of a population.
Numerical impact of the choice: For small samples, the difference between dividing by n and n − 1 is significant. For large samples (n > 30), the difference becomes negligible. The equation for standard deviation with (n − 1) is always the safer, more conservative estimate when working with samples.
How to Calculate Standard Deviation Step by Step
Walking through the equation for standard deviation manually builds deep intuition for what the formula measures. Here is a complete worked example:
Dataset: 10, 12, 23, 23, 16, 23, 21, 16
Step 1 — Count the values:
n = 8
Step 2 — Calculate the mean (x̄):
x̄ = (10 + 12 + 23 + 23 + 16 + 23 + 21 + 16) / 8 = 144 / 8 = 18
Step 3 — Calculate each deviation (xᵢ − x̄):
- 10 − 18 = −8
- 12 − 18 = −6
- 23 − 18 = +5
- 23 − 18 = +5
- 16 − 18 = −2
- 23 − 18 = +5
- 21 − 18 = +3
- 16 − 18 = −2
Step 4 — Square each deviation (xᵢ − x̄)²:
- (−8)² = 64
- (−6)² = 36
- 5² = 25
- 5² = 25
- (−2)² = 4
- 5² = 25
- 3² = 9
- (−2)² = 4
Step 5 — Sum the squared deviations:
Σ(xᵢ − x̄)² = 64 + 36 + 25 + 25 + 4 + 25 + 9 + 4 = 192
Step 6 — Divide by (n − 1) to get the sample variance:
s² = 192 / (8 − 1) = 192 / 7 ≈ 27.4286
Step 7 — Take the square root to get the sample standard deviation:
s = √27.4286 ≈ 5.2371
This is exactly the result the Standard Deviation Calculator produces — with mean = 18.00, variance = 27.4286, and SD = 5.2371. Working through these steps manually reveals why the equation for standard deviation takes the form it does: squaring removes negatives, dividing produces an average, and the square root returns the result to the original units.
Variance and Its Relationship to the Equation For Standard Deviation
Variance and standard deviation are intimately connected — in fact, standard deviation is simply the square root of variance. Understanding this relationship clarifies the equation for standard deviation completely.
Variance (s²):
s² = Σ(xᵢ − x̄)² / (n − 1)
Standard Deviation (s):
s = √s²
Why both measures exist:
- Variance is mathematically convenient — squared deviations add together nicely, and variance has important algebraic properties (variances of independent variables add together)
- Standard deviation is practically convenient — it is in the same units as the original data, making it directly interpretable
Example: If your data is in centimeters, variance is in cm² (squared centimeters), which has no intuitive geometric meaning. But standard deviation is in cm — directly comparable to the original measurements and the mean.
The equation for standard deviation exists precisely to convert the mathematically useful but unit-awkward variance back into the original unit of measurement — making the spread of the data directly interpretable alongside the mean.
How to Use the Standard Deviation Calculator
The Standard Deviation Calculator is designed for effortless use. Here is the complete guide:
Step 1 — Enter Your Numbers Type your data values into the text area, separated by commas. The Standard Deviation Calculator accepts any list of numeric values — integers, decimals, positive or negative numbers. Example: 10, 12, 23, 23, 16, 23, 21, 16
Step 2 — Ensure at Least Two Values The equation for standard deviation requires at least two data points (since we divide by n − 1, we need n ≥ 2). The Standard Deviation Calculator will prompt you if fewer than two valid numbers are detected.
Step 3 — Click “Calculate” Press the Calculate button. The Standard Deviation Calculator instantly parses your input, filters valid numbers, and applies the full equation for standard deviation to produce results.
Step 4 — Review the Results The results panel displays:
- Standard Deviation — the primary output, to four decimal places
- Count (n) — how many valid numbers were processed
- Mean — the arithmetic average of your dataset
- Variance (s²) — the squared spread before taking the square root
Step 5 — Clear and Repeat Use the Clear button to reset the input field and enter a new dataset.
Understanding the Standard Deviation Calculator’s Output
The Standard Deviation Calculator returns four key statistics, each of which contributes to a complete picture of your dataset’s distribution.
Standard Deviation (s): The primary result — the typical distance of a data point from the mean, in the same units as your data. The larger this number, the more spread out your data is.
Count (n): The number of valid numeric values detected in your input. Useful for confirming that all intended data points were correctly parsed.
Mean (x̄): The arithmetic average of all values. Together with the standard deviation, the mean defines the center and spread of your dataset — the two statistics needed to characterize a normal distribution completely.
Variance (s²): The average squared deviation — the intermediate step in the equation for standard deviation before the square root is applied. Variance is used in many advanced statistical formulas (ANOVA, regression analysis, t-tests) and is useful to know even when standard deviation is the primary reported statistic.
Standard Deviation in Education and Grading
Standard deviation is one of the most important tools in educational assessment, used by teachers, administrators, and testing organizations to understand and communicate the spread of student performance.
Class Score Analysis When a teacher computes the mean and standard deviation of exam scores, they can immediately identify whether the class performed consistently (low SD) or varied widely (high SD). The equation for standard deviation applied to 30 student scores tells the teacher far more than the mean alone.
Standardized Testing SAT, ACT, GRE, and IQ scores are all reported on standardized scales designed so that the mean and standard deviation have fixed values (e.g., IQ: mean = 100, SD = 15). These standardized scales are constructed directly from the equation for standard deviation, enabling comparison of individual scores across different test administrations.
Grading on a Curve When professors curve grades, they often use standard deviation to set grade boundaries. Grades one standard deviation above the mean might receive an A, within one standard deviation a B or C, and below by one standard deviation a D or F. The Standard Deviation Calculator provides the standard deviation needed to implement this grading approach.
Standard Deviation in Finance and Investment Analysis
In finance, standard deviation is the primary quantitative measure of investment risk and volatility, and the equation for standard deviation is applied constantly in portfolio management, risk assessment, and options pricing.
Volatility Measurement A stock with high standard deviation of daily returns is volatile — its price moves sharply and unpredictably. A stock with low standard deviation is stable. The equation for standard deviation applied to historical return data gives the volatility figure used in virtually every investment risk model.
Modern Portfolio Theory Harry Markowitz’s Nobel Prize-winning portfolio theory defines portfolio risk as the standard deviation of portfolio returns. The efficient frontier — the set of optimal portfolios — is constructed by minimizing standard deviation for a given expected return. The Standard Deviation Calculator supports the individual asset computations that feed into this analysis.
Value at Risk (VaR) VaR estimates the maximum loss a portfolio might experience over a given period at a specified confidence level. This calculation relies directly on the equation for standard deviation of portfolio returns.
Black-Scholes Option Pricing The Black-Scholes model — the most influential formula in financial economics — requires the standard deviation (volatility) of the underlying asset’s returns as a key input. Every option price computed using Black-Scholes depends on the equation for standard deviation.
Standard Deviation in Science and Research
Scientific measurement and research reporting are inseparable from standard deviation. The equation for standard deviation governs how experimental precision is communicated and how results are compared.
Expressing Measurement Precision When a scientist reports a measurement as “15.3 ± 0.4 cm,” the ± value is typically the standard deviation (or a multiple of it, such as two standard deviations for a 95% confidence interval). The equation for standard deviation quantifies the reproducibility of the measurement — a smaller SD means more precise, repeatable results.
Hypothesis Testing The t-test, F-test, and many other statistical tests use standard deviation as a key input. These tests determine whether differences between groups are statistically significant, and their conclusions depend entirely on the equation for standard deviation applied to each group’s data.
Error Bars on Graphs Scientific graphs frequently display error bars representing ± 1 standard deviation or ± 1 standard error. These error bars are computed from the equation for standard deviation and visually communicate the reliability and spread of experimental data.
Standard Deviation in Quality Control and Manufacturing
Quality control is one of the most practically important applications of the equation for standard deviation, governing manufacturing precision and process consistency worldwide.
Six Sigma The Six Sigma methodology defines quality in terms of standard deviations: a process is “Six Sigma quality” when its defect rate is less than 3.4 per million opportunities — meaning the process output stays within ±6 standard deviations of the target. The equation for standard deviation is literally central to Six Sigma, which is why it is named for the Greek letter σ (sigma) that represents standard deviation.
Control Charts Statistical Process Control (SPC) uses control charts to monitor manufacturing processes. The upper and lower control limits on these charts are set at ±3 standard deviations from the process mean — calculated using the equation for standard deviation from sample measurements.
Tolerance Analysis Engineers use standard deviation to predict what fraction of manufactured parts will fall within specification limits. The probability that a part falls within ±1 SD is 68.27%, within ±2 SD is 95.45%, and within ±3 SD is 99.73% — the empirical rule that governs tolerance analysis in precision manufacturing.
Standard Deviation in Data Science and Machine Learning
The equation for standard deviation appears throughout data science and machine learning, from data preprocessing to model evaluation.
Feature Normalization (Z-Score Standardization) Before training machine learning models, features are often standardized: each value is transformed as z = (x − μ) / σ. This Z-score formula divides by the standard deviation, placing all features on a common scale. The Standard Deviation Calculator provides the σ needed for this transformation.
Anomaly Detection Data points more than 2 or 3 standard deviations from the mean are flagged as potential outliers or anomalies. The equation for standard deviation defines the threshold for this detection — critical in fraud detection, network security monitoring, and sensor data analysis.
Confidence Intervals Confidence intervals — ranges within which a population parameter is estimated to lie with a given probability — are constructed using standard deviation: CI = x̄ ± z × (s/√n). Every confidence interval calculation begins with the equation for standard deviation.
Interpreting Standard Deviation — What the Number Means
Knowing how to compute standard deviation using the equation for standard deviation is only half the skill — interpreting the result correctly is equally important.
The Empirical Rule (68-95-99.7 Rule) For data that follows a normal (bell-curve) distribution:
- ~68% of values fall within ±1 standard deviation of the mean
- ~95% of values fall within ±2 standard deviations of the mean
- ~99.7% of values fall within ±3 standard deviations of the mean
Relative vs. Absolute Interpretation A standard deviation of 5 means very different things for a dataset with a mean of 10 (large variation — 50% of the mean) versus a mean of 10,000 (tiny variation — 0.05% of the mean). The Coefficient of Variation (CV = s/x̄ × 100%) provides a standardized measure of relative variability that controls for the scale of the mean.
Comparing Two Datasets When comparing standard deviations of two datasets, ensure the datasets are measured in the same units and have similar means. The equation for standard deviation produces directly comparable results only when these conditions hold.
Common Mistakes with the Equation For Standard Deviation
Even with a Standard Deviation Calculator, understanding common errors helps you apply the equation for standard deviation correctly:
- Using population formula when sample formula is needed — Dividing by N instead of (n − 1) underestimates the true variability when working with a sample. The Standard Deviation Calculator correctly uses (n − 1) for the most common use case
- Entering fewer than two values — The equation for standard deviation is undefined for a single data point (dividing by n − 1 = 0). Always enter at least two values
- Including non-numeric characters — The Standard Deviation Calculator parses comma-separated values and ignores non-numeric entries. Verify that all intended values are recognized in the Count (n) output
- Confusing standard deviation with variance — Variance is the square of standard deviation. Reporting variance when standard deviation is requested (or vice versa) is a common and consequential error in academic and professional contexts
- Interpreting standard deviation as the maximum deviation — Standard deviation is an average measure of spread, not the maximum distance from the mean. Individual data points may be much farther from the mean than one standard deviation
- Applying the empirical rule to non-normal distributions — The 68-95-99.7 rule applies to normally distributed data. For heavily skewed or multimodal distributions, Chebyshev’s inequality provides a more general (though less precise) bound
Frequently Asked Questions (FAQs)
What is the equation for standard deviation? The equation for standard deviation for a sample is s = √[Σ(xᵢ − x̄)² / (n − 1)], where xᵢ are the data values, x̄ is the sample mean, and n is the number of data points. The Standard Deviation Calculator applies this formula automatically.
What is the difference between population and sample standard deviation? Population standard deviation (σ) divides by N (the total population size) and is used when you have data for the entire population. Sample standard deviation (s) divides by n − 1 and is used when your data is a sample from a larger population — the more common case. The Standard Deviation Calculator uses the sample formula.
Why does the equation for standard deviation use squared deviations? Squaring the deviations (xᵢ − x̄)² serves two purposes: it eliminates negative values (which would cancel out positive deviations if simply summed) and it amplifies larger deviations, giving them proportionally more weight in the final result.
Why does the sample formula use (n − 1) instead of n? Dividing by (n − 1) — Bessel’s correction — produces an unbiased estimate of the population standard deviation when working with a sample. Dividing by n systematically underestimates the population SD because samples tend to be slightly less spread out than the full population.
What does a standard deviation of 0 mean? A standard deviation of 0 means all values in the dataset are identical — there is no variation at all. The equation for standard deviation returns 0 in this case because every deviation (xᵢ − x̄) is 0.
Can standard deviation be negative? No. The equation for standard deviation always produces a non-negative result because it involves squaring deviations (making all terms positive) and then taking a square root.
What is a “good” or “bad” standard deviation? There is no universally good or bad standard deviation — its interpretation depends entirely on the context. For a manufacturing process, a smaller SD means better precision. For an investment portfolio, it depends on the investor’s risk tolerance. The Standard Deviation Calculator gives you the number; context determines its meaning.
How many data points do I need? The Standard Deviation Calculator requires at least two data points (since the sample formula divides by n − 1, and n must be ≥ 2). For reliable statistical estimates, larger samples (n ≥ 30) are generally recommended.
What is the relationship between variance and standard deviation? Standard deviation is the square root of variance: s = √s². The equation for standard deviation is obtained by computing the variance first and then taking the square root to convert back to the original measurement units.
What is the empirical rule for standard deviation? For normally distributed data, approximately 68% of values fall within ±1 standard deviation of the mean, 95% within ±2 standard deviations, and 99.7% within ±3 standard deviations. This rule is fundamental to quality control, finance, and scientific analysis.
Conclusion
The equation for standard deviation is one of the most powerful and widely applied formulas in all of statistics. In a single expression — s = √[Σ(xᵢ − x̄)² / (n − 1)] — it captures the essence of variability: how spread out data points are around their central value, expressed in the original units of measurement, with each deviation weighted proportionally to its magnitude through squaring.
From the classroom to the laboratory, from the trading floor to the factory floor, from data science pipelines to clinical trials, the equation for standard deviation is the universal language of spread and variability. It tells researchers whether their measurements are precise, tells investors whether an asset is risky, tells manufacturers whether a process is consistent, and tells data scientists whether a feature needs normalization or a model needs recalibration.
The Standard Deviation Calculator makes all of this immediately accessible. By accepting any comma-separated dataset, applying the equation for standard deviation automatically, and returning the count, mean, variance, and standard deviation in one operation, the Standard Deviation Calculator removes the computational burden and lets you focus on what the numbers mean.
Master the equation for standard deviation, practice with the Standard Deviation Calculator using your own datasets, and develop the statistical intuition that comes from understanding not just how to calculate standard deviation but why it measures what it measures — the typical distance of each data point from the center of its distribution, the most honest and complete single-number summary of a dataset’s spread.