Check Your BMI Status with the Anorexic BMI Calculator
Table of Contents
- Introduction
- What Is a BMI Index Chart?
- What Is an Overweight Calculator?
- How the BMI Index Chart Classifies Weight Status
- How Our Overweight Calculator Works Step by Step
- Understanding Every Result from the Overweight Calculator
- BMI Score – Your Primary Weight Status Number
- Status – Overweight or Healthy?
- Body Fat Estimate – What BMI Reveals About Fat Percentage
- Risk Factor – Moderate vs. High Health Risk
- Metabolism – Efficient or Slow?
- Joint Load – The Hidden Cost of Excess Weight
- The Five-Category BMI Index Chart Reference Table
- Health Risks Associated with Overweight and Obesity BMI
- The BMI Index Chart for Men vs. Women – Key Differences
- Waist Circumference and the BMI Index Chart – A Combined Approach
- From Overweight to Healthy – A Practical Weight Reduction Guide
- Frequently Asked Questions (FAQs)
- Conclusion
Introduction
More than 1.9 billion adults worldwide are classified as overweight according to the BMI Index Chart — making excess weight one of the most prevalent preventable health challenges of the modern era. Yet despite how widespread the condition is, many people do not know exactly where their weight falls on the clinical scale, what the health risks of their specific BMI category are, or what their personalised target should be. The BMI Index Chart provides the reference framework that answers all of these questions — translating a single calculated number into a clinically meaningful health classification with direct implications for disease risk, metabolic function, and long-term wellbeing.
The BMI Index Chart is the globally standardised visual and numerical reference used by the World Health Organisation, national health bodies, and clinical practitioners worldwide to classify body weight relative to height across a spectrum from severely underweight to severely obese. It is the primary screening tool used in population health surveillance, individual risk assessment, clinical weight management programmes, and nutritional planning — and it is the foundation on which our Overweight Calculator is built.
Our free Overweight Calculator calculates your BMI from your weight and height, applies a gender adjustment factor for physiological accuracy, classifies your result against the full five-category BMI Index Chart, and provides six additional health indicators — from body fat estimation to joint load assessment — that give you a complete picture of what your BMI means for your health. Whether you are trying to confirm a suspected overweight status, track progress through a weight management programme, or simply understand where you stand on the BMI Index Chart for the first time, this tool and this guide give you everything you need to move forward with clarity and confidence.
What Is a BMI Index Chart?
A BMI Index Chart is a standardised reference table that maps Body Mass Index (BMI) values to weight status classifications, enabling individuals and clinicians to instantly determine whether a given BMI represents an underweight, healthy, overweight, or obese body weight. BMI is calculated as weight in kilograms divided by height in metres squared (kg/m²) — producing a single number that accounts for height in a way that raw body weight cannot, making meaningful weight-for-height comparisons possible across individuals of different statures.
The WHO-standardised BMI Index Chart used globally includes five primary categories:
| BMI Range | Classification | Health Significance |
|---|---|---|
| Below 18.5 | Underweight | Malnutrition risk, hormonal disruption, bone density loss |
| 18.5 – 24.9 | Normal Weight | Lowest risk; target range for weight management |
| 25.0 – 29.9 | Overweight | Elevated risk of diabetes, cardiovascular disease, hypertension |
| 30.0 – 34.9 | Obesity Class I | High risk; structured intervention recommended |
| 35.0 – 39.9 | Obesity Class II | Very high risk; specialist management required |
| 40.0 and above | Obesity Class III | Extremely high risk; may require bariatric evaluation |
The BMI Index Chart provides a universal reference language — allowing a BMI of 27.4, for example, to be immediately understood as Overweight by any healthcare professional globally, without requiring additional context or calculation. This standardisation is the primary reason the BMI Index Chart has become the world’s most widely used weight classification system despite its well-documented limitations.
Why the BMI Index Chart matters:
- Population surveillance: Governments and health organisations use BMI Index Chart data to track obesity trends, allocate health resources, and design public health interventions
- Individual screening: The BMI Index Chart provides the first-line screening result that determines whether further assessment (waist circumference, body composition, metabolic testing) is warranted
- Clinical risk stratification: Healthcare providers use BMI Index Chart categories to determine which patients need weight management counselling, medication, or surgical referral
What Is an Overweight Calculator?
An Overweight Calculator is a health tool that calculates your Body Mass Index, classifies your result against the BMI Index Chart, and determines whether your weight falls in the Overweight category (BMI 25.0 to 29.9) or beyond. It goes further than a simple BMI number — providing context-specific health indicators that translate your BMI Index Chart position into practical information about body fat percentage, metabolic efficiency, joint stress, cardiovascular risk, and your personalised weight target.
Our Overweight Calculator is built around the five-category BMI Index Chart — covering the full weight spectrum from Normal through all three obesity classes — and produces seven clinical result indicators alongside the reference table, giving you both the classification and the health context in a single calculation.
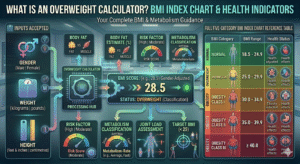
Inputs accepted:
- Gender (Male or Female — with gender-specific BMI adjustment)
- Weight (kilograms or pounds)
- Height (feet and inches or centimetres)
Outputs produced:
- BMI Score (gender-adjusted)
- Status (Overweight or Healthy)
- Body Fat Estimate (%)
- Risk Factor (High or Moderate)
- Metabolism classification
- Joint Load assessment
- Target BMI (< 25)
- Full five-category BMI Index Chart reference table
How the BMI Index Chart Classifies Weight Status
Understanding each category in the BMI Index Chart provides the clinical context needed to interpret your Overweight Calculator result meaningfully:
Normal Weight (BMI 18.5 to 24.9): The target zone in the BMI Index Chart — the range associated with the lowest all-cause mortality and the lowest incidence of weight-related chronic disease. The Overweight Calculator classifies any result in this range as “Healthy” status with “Efficient” metabolism and “Stable” joint load. Maintaining a BMI within this Normal range is the primary goal of weight management for individuals currently above it.
Overweight (BMI 25.0 to 29.9): The first elevated-risk category in the BMI Index Chart. At this BMI level, risk of type 2 diabetes, hypertension, dyslipidaemia, sleep apnoea, and cardiovascular disease is measurably elevated above the Normal range — but the relationship is graded, meaning a BMI of 25.5 carries lower absolute risk than a BMI of 29.8, even though both are classified as Overweight in the BMI Index Chart. The Overweight Calculator flags this range with “Moderate” Risk Factor, “Slow” Metabolism, and “Critical” Joint Load.
Obesity Class I (BMI 30.0 to 34.9): Significant excess weight with substantially elevated cardiometabolic risk. The BMI Index Chart Class I Obesity range is associated with doubling or tripling of type 2 diabetes risk, significant hypertension prevalence, non-alcoholic fatty liver disease, and accelerated joint degeneration. The Overweight Calculator’s Risk Factor shifts to “High” at BMI 30 and above.
Obesity Class II (BMI 35.0 to 39.9): High-risk obesity requiring structured medical management. At this level on the BMI Index Chart, comorbidity burden is typically high — including multiple concurrent conditions such as diabetes, hypertension, sleep apnoea, and musculoskeletal complications. Bariatric evaluation is increasingly considered in this range when lifestyle intervention has been unsuccessful.
Obesity Class III (BMI 40.0 and above): Severe or morbid obesity — the highest-risk category in the BMI Index Chart. At this BMI level, life expectancy is measurably reduced, and bariatric surgery is considered a first-line treatment option for eligible individuals. The Overweight Calculator’s target of BMI < 25 represents a substantial journey from this category — one best managed with specialist medical support.
How Our Overweight Calculator Works Step by Step
Using the Overweight Calculator is a straightforward four-step process:
Step One – Select Gender: Choose Male (factor: 1.0) or Female (factor: 1.05). The female gender adjustment (1.05) in the Overweight Calculator accounts for the fact that women typically carry a higher percentage of body fat than men at equivalent BMI values — meaning the same BMI represents slightly different physiological states across genders. The adjustment produces a slightly higher effective BMI for female inputs, more accurately reflecting the higher fat-to-lean ratio at equivalent gross weight-for-height values.
Step Two – Enter Weight and Select Unit: Enter your current body weight and choose kilograms or pounds. The Overweight Calculator converts pounds to kilograms (× 0.453592) before applying the BMI formula. For the most accurate Overweight Calculator result, weigh yourself in the morning after using the bathroom, without clothing, and before eating or drinking — this minimises the 1 to 2 kg of normal daily weight variation from food, water, and glycogen stores.
Step Three – Select Height Mode and Enter Height: Choose Feet & Inches or Centimetres and enter your measured height. Height accuracy directly determines BMI accuracy — a 2 cm height error shifts BMI by approximately 0.3 to 0.5 units, which can move a result across the Normal/Overweight boundary at borderline values. Use your measured height from a recent medical visit rather than a remembered or estimated figure.
Step Four – Click Calculate: Instantly receive your complete BMI Index Chart classification — seven health indicators in the Results panel and the five-category reference table. The Overweight Calculator produces all results simultaneously — no additional inputs or steps required.
Understanding Every Result from the Overweight Calculator
The Overweight Calculator Results panel provides seven clinical outputs — each contextualising a different health dimension of your BMI Index Chart position:
BMI Score: The gender-adjusted BMI value — your position on the BMI Index Chart expressed as a single number. This is the primary result from which all other indicators are derived. A BMI Score of 25.0 or above places you in the Overweight or Obese categories on the BMI Index Chart; below 25.0 is the Healthy target zone.
Status: Classified as Overweight (BMI ≥ 25) or Healthy (BMI < 25). This binary classification directly maps to the BMI Index Chart boundary between Normal Weight and Overweight — the most clinically significant threshold for weight management decision-making. A Healthy status means your BMI falls within the Normal range of the BMI Index Chart; an Overweight status means you are at or above the threshold where risk-elevating excess weight begins.
Body Fat Estimate: Calculated as BMI × 1.2, expressed as a percentage. This rough estimate provides a bridge between the BMI Index Chart classification and body composition context. At BMI 27, the estimated body fat is approximately 32.4% — above the 25% to 30% healthy range for women and well above the 18% to 24% healthy range for men. At BMI 35, the estimate rises to approximately 42% — indicating severe excess adiposity. The body fat estimate from the Overweight Calculator is an approximation, not a clinical measurement — DEXA scan or hydrostatic weighing provides definitive body composition data.
Risk Factor: Classified as High (BMI ≥ 30) or Moderate (BMI < 30). The BMI Index Chart threshold of 30.0 — the boundary between Overweight and Obesity Class I — represents the point at which absolute cardiometabolic risk escalates most steeply. The Moderate Risk Factor at BMI 25 to 29.9 reflects real but less acute elevated risk; the High Risk Factor at BMI 30+ reflects the more urgent intervention priority associated with clinical obesity.
Metabolism: Classified as Slow (BMI ≥ 25) or Efficient (BMI < 25). Excess adipose tissue — particularly visceral fat — disrupts metabolic efficiency through insulin resistance, inflammatory cytokine production, and impaired fatty acid oxidation. A Slow metabolism classification at overweight BMI levels reflects the real metabolic impact of excess body fat on energy utilisation, blood glucose regulation, and hormonal signalling.
Joint Load: Classified as Critical (BMI ≥ 25) or Stable (BMI < 25). Every kilogram of excess body weight places approximately 4 kilograms of additional force on the knee joints during walking — and up to 6 kilograms during stair climbing or running. At BMI 28 (10 kg above a BMI 23 reference weight for a 170 cm person), the additional knee joint load is approximately 40 to 60 kg per step. The Critical Joint Load classification at overweight BMI values reflects the direct mechanical consequence of excess weight on musculoskeletal health — accelerating osteoarthritis, increasing injury risk, and reducing mobility.
Target: Displayed as “< 25 BMI” — the universal goal of returning to or remaining within the Normal Weight range of the BMI Index Chart. This target applies regardless of the current BMI category — whether overweight at BMI 27 or severely obese at BMI 42, the directional goal of the Overweight Calculator is the same: movement toward the Normal range of the BMI Index Chart.
BMI Score – Your Primary Weight Status Number
The BMI formula at the core of the Overweight Calculator:
BMI = Weight (kg) ÷ Height (m²) × Gender Factor
For a 85 kg woman at 170 cm: BMI = 85 ÷ (1.70 × 1.70) × 1.05 = 85 ÷ 2.89 × 1.05 = 29.4 × 1.05 = 30.9 — Obesity Class I
For a 85 kg man at 170 cm: BMI = 85 ÷ (1.70 × 1.70) × 1.0 = 85 ÷ 2.89 = 29.4 — Overweight
This example illustrates why the gender factor matters — the same absolute weight and height produce different BMI Index Chart classifications for men and women because the physiological composition at those measurements differs systematically by sex. The Overweight Calculator’s gender adjustment prevents this systematic underestimation of female cardiometabolic risk at equivalent gross body measurements.
Status – Overweight or Healthy?
The BMI 25.0 threshold in the BMI Index Chart — the boundary used for the Overweight Calculator’s Status classification — was established by the WHO based on population-level evidence showing that health risk increases measurably above this point:
Why 25.0 is the overweight threshold: Large-scale prospective studies — including the Prospective Studies Collaboration (nearly 900,000 participants) and the Global BMI Mortality Collaboration (over 10 million adults) — consistently demonstrate that all-cause mortality begins increasing at BMI above 25 in non-smokers across most populations studied. The 25.0 BMI Index Chart threshold represents the evidence-based inflection point where excess weight begins contributing meaningfully to premature mortality risk.
The limitations of a binary Status classification: A BMI of 25.1 and a BMI of 29.8 both receive an “Overweight” Status from the Overweight Calculator — but their absolute risk levels differ substantially. Use the BMI Index Chart reference table alongside the Status result to understand whether you are at the lower or upper end of the Overweight category — as this determines the urgency and intensity of weight management intervention appropriate for your situation.
Body Fat Estimate – What BMI Reveals About Fat Percentage
The Overweight Calculator’s Body Fat Estimate (BMI × 1.2) provides a rough approximation of body fat percentage from the BMI Index Chart position:
Healthy body fat ranges (for reference):
- Women (age 20 to 39): 21% to 32% is healthy; above 32% is excess
- Women (age 40 to 59): 23% to 33% is healthy; above 33% is excess
- Men (age 20 to 39): 8% to 19% is healthy; above 25% is excess
- Men (age 40 to 59): 11% to 21% is healthy; above 26% is excess
The Overweight Calculator’s BMI × 1.2 formula is an approximation, not a replacement for direct body composition measurement. It is most useful for contextualising the BMI Index Chart result — confirming that an Overweight or Obese BMI score corresponds to an estimated body fat percentage that is above healthy reference ranges.
The most important limitation: BMI-based fat estimates cannot distinguish between fat mass and lean mass. A highly muscular athlete at BMI 28 may have 18% body fat — well within the healthy range — while the Overweight Calculator’s estimate would suggest approximately 33.6%. For muscular individuals, the BMI Index Chart Overweight classification may overstate actual fat-related health risk. In such cases, waist circumference or DEXA scan data provides a more accurate health risk picture.
Risk Factor – Moderate vs. High Health Risk
The Risk Factor indicator in the Overweight Calculator escalates from Moderate to High at BMI 30 — the Overweight-to-Obesity Class I boundary on the BMI Index Chart. Understanding what this shift means clinically:
Moderate Risk (BMI 25 to 29.9 on the BMI Index Chart): At this level, the absolute risk of the following conditions is meaningfully elevated above Normal weight but has not reached the higher absolute rates of obesity:
- Type 2 diabetes: Risk approximately 2× to 3× Normal weight
- Hypertension: Approximately 60% higher prevalence than Normal weight
- Dyslipidaemia: Elevated LDL cholesterol and triglycerides, reduced HDL
- Sleep apnoea: Significant risk increase; fat deposition around the neck reduces airway diameter
- Certain cancers: Endometrial, postmenopausal breast, and colon cancer risk modestly elevated
High Risk (BMI 30+ on the BMI Index Chart): Risk escalation is more pronounced at obesity levels:
- Type 2 diabetes: Risk 7× to 10× that of Normal weight individuals
- Cardiovascular disease: Substantially elevated myocardial infarction and stroke risk
- Non-alcoholic fatty liver disease (NAFLD): Present in over 75% of individuals with obesity
- Osteoarthritis: Mechanical joint loading accelerates cartilage breakdown significantly
- Sleep apnoea: Severe in many individuals with BMI above 35
Metabolism – Efficient or Slow?
The Metabolism indicator in the Overweight Calculator — Efficient (BMI < 25) or Slow (BMI ≥ 25) — reflects the real metabolic consequences of excess adiposity:
How excess fat impairs metabolic efficiency:
Insulin Resistance: Excess visceral fat (the fat stored around internal organs — not subcutaneous fat stored under the skin) secretes free fatty acids and inflammatory cytokines that impair insulin receptor signalling. Insulin resistance means cells are less responsive to insulin’s glucose-uptake signals — forcing the pancreas to produce ever-higher insulin levels to maintain blood glucose control. This metabolic dysfunction is the precursor to type 2 diabetes and is reflected in the “Slow” metabolism classification of the Overweight Calculator at BMI ≥ 25.
Leptin Resistance: Adipose tissue produces leptin — the satiety hormone that signals the brain to reduce appetite when fat stores are sufficient. In overweight and obese individuals, chronic leptin overproduction causes leptin resistance — the brain stops responding adequately to satiety signals, disrupting appetite regulation and making caloric restriction subjectively harder. This physiological cycle contributes to the self-reinforcing nature of obesity beyond the BMI Index Chart Normal range.
Reduced Mitochondrial Efficiency: Obesity is associated with reduced mitochondrial biogenesis and impaired oxidative phosphorylation in skeletal muscle — meaning the metabolic machinery for burning fat as fuel becomes less efficient. This further slows energy expenditure and fat oxidation, creating a disadvantageous metabolic environment that makes further weight gain easier and weight loss more difficult.
Joint Load – The Hidden Cost of Excess Weight
The “Critical” Joint Load classification in the Overweight Calculator at BMI ≥ 25 reflects one of the most tangible and immediately impactful consequences of excess body weight:
Mechanical amplification of body weight at the joints: The knee joint experiences a load of approximately 3 to 5 times body weight during normal walking. For a 90 kg person, this means approximately 270 to 450 kg of force per knee per step. Every additional kilogram of body weight therefore adds 3 to 5 kg of force to each knee with every step taken — and since the average person takes 6,000 to 10,000 steps per day, the cumulative additional joint stress from even modest excess weight is substantial.
Osteoarthritis and BMI Index Chart position: Knee osteoarthritis prevalence increases steeply with BMI. Individuals with BMI above 30 (Obesity Class I on the BMI Index Chart) have approximately 4 to 5 times higher risk of knee osteoarthritis than Normal weight individuals. The progressive nature of osteoarthritis — cartilage loss is largely irreversible — makes the joint load consequence of sustained overweight BMI one of the most compelling long-term arguments for returning to the Normal range.
Weight loss and joint benefit: Fortunately, the joint benefits of weight loss are amplified by the same mechanical ratio. Losing 5 kg reduces knee joint load by approximately 15 to 25 kg per step — a disproportionately large benefit relative to the modest weight reduction required.
The Five-Category BMI Index Chart Reference Table
The complete reference table in the Overweight Calculator displays the full BMI Index Chart from Normal Weight through all three Obesity classes:
Normal (18.5 to 24.9): The healthy target. Lowest all-cause mortality, optimal metabolic function, normal cardiovascular risk. Moving from any overweight or obese category back to this BMI Index Chart range is the clinical goal of weight management intervention.
Overweight (25.0 to 29.9): Moderate cardiometabolic risk. Lifestyle intervention — combining dietary modification and increased physical activity — is the first-line recommended approach. Even a 5% to 10% body weight reduction from within this BMI Index Chart category produces measurable metabolic improvements (reduced fasting blood glucose, improved lipid profile, reduced blood pressure) before Normal weight is reached.
Obesity I (30.0 to 34.9): High risk. Lifestyle intervention intensified; pharmacological weight management options may be considered. The BMI Index Chart Obesity I threshold of 30 is the trigger point for formal weight management programme referral in most national health guidelines.
Obesity II (35.0 to 39.9): Very high risk. At this BMI Index Chart level, bariatric surgery eligibility criteria are often met — particularly when concurrent diabetes or hypertension is present. Multidisciplinary management (physician, dietitian, psychologist, exercise physiologist) is the standard of care.
Obesity III (40.0 and above): Extremely high risk. The BMI Index Chart’s highest classification corresponds to the most severe obesity category — one in which pharmacological and surgical intervention are increasingly the most evidence-based treatment options when intensive lifestyle intervention alone has been insufficient.
Health Risks Associated with Overweight and Obesity BMI
The health consequences of sustained overweight or obese BMI Index Chart status span multiple organ systems and disease categories:
Cardiovascular Disease: Obesity is a major independent risk factor for coronary artery disease, heart failure, and stroke. Excess adiposity promotes atherosclerosis through dyslipidaemia, hypertension, chronic inflammation, and insulin resistance — all of which accelerate arterial plaque formation. The relationship between BMI and cardiovascular risk is continuous — risk increases with every point above the BMI Index Chart Normal range.
Type 2 Diabetes: Excess visceral fat is the primary driver of insulin resistance — the metabolic precursor to type 2 diabetes. Over 80% of type 2 diabetes cases occur in individuals with a BMI above 25 on the BMI Index Chart. Weight loss of 7% to 10% of body weight has been shown in landmark trials (Diabetes Prevention Program) to reduce type 2 diabetes incidence by 58% in high-risk individuals.
Sleep Apnoea: BMI above 30 is the single strongest predictor of obstructive sleep apnoea — a condition in which airway collapse during sleep produces repeated oxygen desaturation, fragmenting sleep and increasing cardiovascular risk. Weight loss of 10% to 15% significantly reduces apnoea-hypopnoea index in many affected individuals.
Certain Cancers: The International Agency for Research on Cancer (IARC) has identified overweight and obesity as causes of 13 cancers — including endometrial, postmenopausal breast, colon, kidney, oesophageal adenocarcinoma, and liver cancer. BMI above the Normal range on the BMI Index Chart is directly associated with higher circulating oestrogen, insulin, and inflammatory cytokines — all of which promote tumour development.
The BMI Index Chart for Men vs. Women – Key Differences
The BMI Index Chart applies the same numerical thresholds to men and women, but the health implications differ in several important ways:
Fat Distribution: Men tend to accumulate fat preferentially in the abdomen (android or “apple” pattern) — visceral fat that is more metabolically active and more strongly associated with cardiovascular risk. Women tend to accumulate fat in the hips, thighs, and gluteal region (gynoid or “pear” pattern) — subcutaneous fat that is less metabolically harmful. At equivalent BMI Index Chart positions, men often face higher immediate cardiovascular risk despite women carrying a higher total body fat percentage.
Menopause and BMI: At menopause, oestrogen decline promotes visceral fat accumulation — shifting women’s fat distribution pattern toward the higher-risk android pattern. Post-menopausal women at the same BMI Index Chart position carry higher cardiometabolic risk than pre-menopausal women, reflecting this hormonal shift. The Overweight Calculator’s female gender adjustment (1.05) partially captures this systematic difference.
The Gender Factor in Our Overweight Calculator: The 1.05 female multiplier adjusts for the systematically higher body fat percentage that women carry at equivalent BMI values — producing a slightly higher effective BMI that better reflects physiological risk for female users. This makes the Overweight Calculator’s Status, Risk Factor, and other indicators more clinically accurate for women than an unadjusted BMI calculation would be.
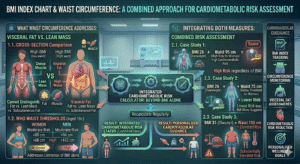
Waist Circumference and the BMI Index Chart – A Combined Approach
The BMI Index Chart has one well-recognised limitation — it cannot distinguish between fat mass and lean mass, or between the more dangerous visceral fat and the less dangerous subcutaneous fat. Waist circumference, used alongside the BMI Index Chart, addresses this limitation:
WHO waist circumference thresholds for elevated cardiometabolic risk:
- Women: Above 80 cm (moderate risk), above 88 cm (high risk)
- Men: Above 94 cm (moderate risk), above 102 cm (high risk)
Using both measures together:
- BMI 26 (Overweight on BMI Index Chart) + Waist 95 cm (high risk for a woman) = high cardiometabolic risk regardless of BMI
- BMI 26 (Overweight on BMI Index Chart) + Waist 75 cm (below risk threshold) = lower risk than BMI alone suggests
- BMI 31 (Obesity I on BMI Index Chart) + Waist 100 cm = substantially elevated risk
For individuals at borderline BMI Index Chart positions (particularly around the 25.0 Overweight threshold), measuring waist circumference provides crucial additional context that the Overweight Calculator’s BMI-based assessment alone cannot capture. A waist circumference above the risk threshold at any BMI — including Normal weight — warrants cardiovascular risk assessment.
From Overweight to Healthy – A Practical Weight Reduction Guide
Moving from an Overweight or Obese BMI Index Chart position to the Normal Weight range requires a structured, sustainable approach:
Set Interim Milestones: The journey from BMI 32 to BMI 24 is not one goal — it is a series of BMI Index Chart milestones: Obesity I to Overweight (reach BMI 29.9), Overweight to Normal (reach BMI 24.9). Each category transition on the BMI Index Chart represents meaningful risk reduction and a celebration-worthy milestone. Use the Overweight Calculator at each milestone to confirm your BMI Index Chart transition and update your remaining target.
The 500 kcal/day Deficit Principle: A daily caloric deficit of 500 kcal below your TDEE (Total Daily Energy Expenditure) produces approximately 0.45 kg of fat loss per week — the most evidence-based and sustainable rate for preserving lean mass. At this rate, a 10 kg reduction requires approximately 22 weeks — moving most overweight individuals from Overweight to the upper end of Normal Weight on the BMI Index Chart within five to six months.
Protein Priority: Maintaining protein intake at 1.6 to 2.0 grams per kilogram of body weight during a caloric deficit preserves lean muscle mass — ensuring that the weight lost is predominantly fat rather than muscle. Every kilogram of lean mass preserved during weight loss means a higher resting BMR, supporting the long-term metabolic efficiency that the Overweight Calculator classifies as “Efficient” at BMI < 25.
Resistance Training: Progressive resistance training during weight loss does double duty — preserving and building lean mass (which prevents BMR reduction) while contributing directly to caloric expenditure. Individuals who combine resistance training with dietary modification during weight loss consistently show better body composition outcomes than those who rely on dietary modification alone.
Consistency Over Intensity: The most effective weight management approach is not the most aggressive one — it is the most sustainable one. Moderate, consistent caloric deficits maintained over months produce better long-term BMI Index Chart improvements than aggressive short-term restriction followed by rebound weight gain.
Frequently Asked Questions (FAQs)
What is a BMI Index Chart? A BMI Index Chart is the standardised reference table that classifies Body Mass Index values into health categories — Underweight (below 18.5), Normal (18.5 to 24.9), Overweight (25.0 to 29.9), and three Obesity classes (30+). It is used globally by clinicians and health organisations to assess weight-related health risk.
What is an Overweight Calculator? An Overweight Calculator is a BMI-based health tool that calculates your BMI, classifies it against the BMI Index Chart, and provides additional health indicators — including body fat estimation, risk factor, metabolism classification, and joint load — to contextualise what your BMI means for your health.
What BMI is considered overweight? According to the BMI Index Chart, a BMI of 25.0 to 29.9 is classified as Overweight. Above 30 is Obesity Class I, II, or III depending on severity. The Overweight Calculator classifies any BMI at or above 25 as Overweight status.
Is BMI 25 dangerously overweight? BMI 25 — the lower boundary of Overweight on the BMI Index Chart — carries elevated but modest health risk. A BMI of 25 is associated with mildly increased cardiovascular and metabolic risk relative to the 18.5 to 24.9 Normal range, but the absolute risk difference at BMI 25 is much smaller than at BMI 30 or above. Even at BMI 25, weight management to move back within the Normal BMI Index Chart range is clinically beneficial.
How accurate is the Overweight Calculator’s body fat estimate? The BMI × 1.2 body fat estimate is an approximation — useful for contextualising the BMI Index Chart result but not a clinical measurement. For accurate body fat percentage, DEXA scan, hydrostatic weighing, or BodPod assessment is recommended.
Why does the Overweight Calculator apply a different gender factor for women? Women carry a higher percentage of essential body fat than men at equivalent BMI values — typically 5% to 8% more total body fat. The 1.05 female gender factor in the Overweight Calculator reflects this systematic difference, producing a slightly higher effective BMI that more accurately represents physiological fat-related health risk for female users.
Can I be overweight on the BMI Index Chart but metabolically healthy? Yes — a subset of overweight individuals (sometimes called “metabolically healthy obese”) show normal blood glucose, blood pressure, and lipid levels despite elevated BMI. However, research suggests this metabolically healthy overweight status is often temporary — and that most individuals in this group develop metabolic abnormalities over a 5 to 10 year follow-up period. A Normal BMI Index Chart status remains the evidence-based target for long-term health.
How often should I use the Overweight Calculator? Recalculate every 4 to 6 weeks during active weight management to track BMI Index Chart progress accurately. More frequent recalculation (weekly) adds noise from normal weight fluctuation without adding meaningful trend data.
Conclusion
The BMI Index Chart is the most widely used weight classification system in the world for a reason — it translates the complex relationship between body weight and health risk into a single, universally understood number. Whether you are using the Overweight Calculator to confirm an overweight status, track progress toward the Normal range, or understand the health implications of your current BMI, the BMI Index Chart provides the evidence-based framework that gives your number clinical meaning.
Our free Overweight Calculator delivers your complete BMI Index Chart position — with gender-adjusted BMI, health status classification, body fat estimation, risk factor, metabolism and joint load assessment, and your personalised BMI target — in a single calculation. It transforms the BMI Index Chart from an abstract reference into a personalised health assessment that tells you not just where you are but what that means and where you need to go.
The journey from an elevated BMI Index Chart category back to the Normal Weight range is one of the most impactful health investments any individual can make. Every kilogram of weight reduction reduces joint load, improves metabolic efficiency, lowers cardiovascular risk, and moves your BMI Index Chart position closer to the target that decades of research consistently identifies as the zone of optimal health.
Use the Overweight Calculator and the BMI Index Chart together today. Know your number. Understand your risk. And take the first step toward a weight that supports the long, healthy, active life you deserve.