|Statistics Calculator
Enter numbers separated by commas, spaces, or new lines.
Calculate P value instantly with our fast and accurate P Value Calculator
Table of Contents
- Introduction
- What Is a Statistics Calculator?
- What Is This Formula and How Does It Work?
- Types of the Formula
- How to Calculate Standard Deviation Step by Step
- Understanding Each Component of the Formula
- Population vs. Sample: When to Use Which Version
- Real-World Applications
- Tips for Accurate Standard Deviation Calculations
- Common Mistakes to Avoid
- Frequently Asked Questions (FAQs)
- Conclusion
Introduction
Statistics is the language of data, and no concept within statistics is more universally used than standard deviation. Whether you are analyzing exam scores in a classroom, measuring the volatility of stocks in finance, monitoring product quality in manufacturing, or conducting scientific research — the Standard Deviation Formula is the tool that tells you how spread out your data really is.
Understanding the Standard Deviation Formula is not just a requirement for math students; it is a core skill for data analysts, scientists, engineers, teachers, and business professionals. It gives you a single, powerful number that summarizes the variability within a dataset. A small standard deviation means your data points are tightly clustered around the average. A large standard deviation means they are widely scattered.
In this complete guide, you will learn exactly what the Standard Deviation Formula is, how to apply it step by step, what each component means, and how to use it confidently in real-world situations. We will also walk through the Statistics Calculator that makes these computations instant and effortless.
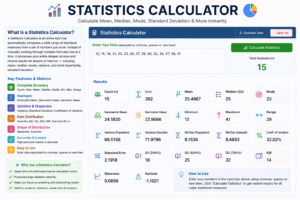
What Is a Statistics Calculator?
A Statistics Calculator is an online tool that automatically computes a wide range of statistical measures from a set of numbers you enter. Instead of manually working through complex formulas one at a time, a Statistics Calculator processes your entire dataset at once and returns results for dozens of metrics — including mean, median, mode, variance, and most importantly, standard deviation.
Here is what a good Statistics Calculator typically computes:
- Count (n) — the total number of values in your dataset
- Sum — the total of all values added together
- Mean — the arithmetic average of all values
- Median — the middle value when data is sorted
- Mode — the most frequently occurring value
- Geometric Mean — useful for growth rates and ratios
- Harmonic Mean — useful for rates and speeds
- Minimum and Maximum — the smallest and largest values
- Range — the difference between maximum and minimum
- Variance (sample and population) — the average squared deviation from the mean
- Standard Deviation (sample and population) — the key measure of data spread
- Coefficient of Variation — standard deviation as a percentage of the mean
- Standard Error of the Mean — how much the sample mean varies
- Quartiles (Q1, Q2, Q3) — data split into four equal parts
- Interquartile Range (IQR) — the spread of the middle 50% of data
- Skewness — how asymmetric the distribution is
- Kurtosis — how peaked or flat the distribution is
Using a Statistics Calculator saves significant time, eliminates calculation errors, and allows you to focus on interpreting results rather than computing them. To use it, simply enter your numbers separated by commas, spaces, or new lines — and the tool handles everything instantly.
What Is the Standard Deviation Formula?
The Standard Deviation Formula is a mathematical expression used to measure how much individual values in a dataset deviate from the mean (average). It is one of the most important formulas in all of statistics because it quantifies variability in a single, interpretable number.
Conceptually, this formula answers the question: On average, how far are the data points from the mean?
Here is the core idea:
- If all data points are identical, the standard deviation is zero — there is no variation at all.
- If the data points are widely spread, the standard deviation is large — indicating high variability.
- If the data points are tightly clustered around the mean, the standard deviation is small — indicating low variability.
This formula exists in two versions, depending on whether you are working with an entire population or a sample drawn from a population. Both follow the same logic but differ in one critical step during calculation.
Types of Standard Deviation Formula
There are two main types of the Standard Deviation Formula, and knowing which one to use is essential for getting accurate results.
Population Standard Deviation Formula
The population version is used when your dataset includes every member of the group you are studying. For example, if you are analyzing the ages of all 30 students in a specific classroom, that is your entire population.
Formula: σ = √[ Σ(xᵢ − μ)² / N ]
Where:
- σ (sigma) = population standard deviation
- Σ = sum of all values
- xᵢ = each individual data point
- μ (mu) = population mean
- N = total number of data points in the population
Sample Standard Deviation Formula
The sample version is used when your dataset is only a subset of a larger population. This is the version used in most real-world research, surveys, and experiments — because it is rarely possible to collect data from every member of a population.
Formula: s = √[ Σ(xᵢ − x̄)² / (n − 1) ]
Where:
- s = sample standard deviation
- Σ = sum of all values
- xᵢ = each individual data point
- x̄ (x-bar) = sample mean
- n = number of data points in the sample
- (n − 1) = Bessel’s correction, which adjusts for the bias introduced by using a sample instead of the full population
The only mathematical difference between these two versions is the denominator — population uses N, while sample uses (n − 1). This correction makes the sample version an unbiased estimator of the population standard deviation.
How to Calculate Standard Deviation Step by Step
Applying the Standard Deviation Formula manually involves five clear steps. Understanding each step builds a solid intuition for what the formula is actually measuring.
Step 1 — Find the Mean Add all data points together and divide by the count. This gives you the average (mean), which is the center point around which spread is measured.
Step 2 — Find Each Deviation from the Mean Subtract the mean from each individual data point. Some deviations will be positive (above the mean) and some will be negative (below the mean). This shows how far each point sits from the center.
Step 3 — Square Each Deviation Square every deviation calculated in Step 2. Squaring serves two purposes: it removes negative signs, and it amplifies larger deviations so they carry more weight in the final result.
Step 4 — Find the Average of the Squared Deviations (Variance) Add all the squared deviations together. Then divide by N (for population) or by (n − 1) (for sample). This result is the variance.
Step 5 — Take the Square Root Take the square root of the variance. This brings the unit back to the original unit of measurement. The result is the standard deviation — the final output of the Standard Deviation Formula.
Worked Example
Dataset: 4, 8, 6, 5, 3, 2, 8, 9, 2, 5
- Count (n): 10
- Sum: 52
- Mean (x̄): 52 ÷ 10 = 5.2
| Data Point | Deviation (xᵢ − x̄) | Squared Deviation |
|---|---|---|
| 4 | −1.2 | 1.44 |
| 8 | 2.8 | 7.84 |
| 6 | 0.8 | 0.64 |
| 5 | −0.2 | 0.04 |
| 3 | −2.2 | 4.84 |
| 2 | −3.2 | 10.24 |
| 8 | 2.8 | 7.84 |
| 9 | 3.8 | 14.44 |
| 2 | −3.2 | 10.24 |
| 5 | −0.2 | 0.04 |
- Sum of Squared Deviations: 57.60
- Sample Variance: 57.60 ÷ (10 − 1) = 6.40
- Sample Standard Deviation: √6.40 ≈ 2.53
This means each data point is, on average, about 2.53 units away from the mean of 5.2.
Understanding Each Component of the Formula
Every symbol and operation in this formula has a specific, logical purpose. Understanding these components transforms it from a mysterious string of symbols into a transparent, intuitive process.
The Mean (μ or x̄) The mean is the reference point — the center of the data. This formula measures spread relative to this center. Without the mean, there would be no baseline to measure distance from.
The Deviation (xᵢ − mean) This term captures how far each individual value sits from the mean. A value far from the mean produces a large deviation; a value close to the mean produces a small deviation. These deviations are the raw material of the entire calculation.
The Squared Deviation [(xᵢ − mean)²] Squaring the deviations eliminates negative signs — which would otherwise cancel out when summed. It also penalizes extreme outliers more heavily, making the Standard Deviation Formula sensitive to values far from the center.
The Summation (Σ) The sigma symbol (Σ) means “add up all values.” In the context of this formula, it means: add up all the squared deviations. This gives the total accumulated spread across all data points.
The Denominator (N or n − 1) This is the averaging step. Dividing by N gives the population variance; dividing by (n − 1) gives the sample variance. Using (n − 1) instead of n corrects for the tendency of small samples to underestimate true population variability.
The Square Root (√) Taking the square root of the variance returns the result to the original unit of measurement. If your data is in kilograms, the standard deviation will also be in kilograms — making the final result directly comparable to the original data values.
Population vs. Sample: When to Use Which Version
One of the most common points of confusion with standard deviation is deciding whether to use the population or sample version. Here is a clear, practical guide.
Use the population Standard Deviation Formula when:
- You have data for every single member of the group being studied
- Examples: all test scores from one specific class; all items produced in a single factory run; all votes cast in an election you have full access to
Use the sample Standard Deviation Formula when:
- Your data is only a subset of a larger group
- This is the correct choice in the vast majority of real-world research and analysis
- Examples: survey responses from 500 out of 10,000 customers; clinical trial results from 200 patients representing a larger patient population; quality measurements from 50 randomly selected items out of thousands produced
As a practical rule: if there is any doubt, use the sample version. Most datasets encountered in business, science, medicine, and social research are samples — not complete populations. The Statistics Calculator shown above computes both versions automatically, so you can compare them and choose the one appropriate for your context.
Real-World Applications
Standard deviation is one of the most widely applied tools in data analysis. Here are the major fields where it plays a critical role.
Finance and Investment In finance, standard deviation measures investment risk. A stock with a high standard deviation has historically shown wild price swings — making it a riskier but potentially higher-reward investment. Portfolio managers use the Standard Deviation Formula to compare the volatility of different assets and construct balanced portfolios.
Education and Testing Teachers and education researchers use the Standard Deviation Formula to analyze test score distributions. A small standard deviation means most students scored near the average, suggesting consistent understanding. A large standard deviation suggests widely varying levels of mastery within the group.
Manufacturing and Quality Control In manufacturing, engineers apply this formula to monitor product dimensions, weights, or performance metrics. If standard deviation exceeds a defined threshold, it signals that the production process is out of control — triggering corrective action before defective products reach customers.
Medicine and Clinical Research Clinical researchers use standard deviation to describe variability in patient measurements — blood pressure, cholesterol levels, dosage responses. Understanding this formula helps determine whether results from a clinical trial are statistically significant or simply due to natural variation within the patient population.
Weather and Environmental Science Meteorologists use standard deviation to measure temperature variability across seasons and locations. A city with a low standard deviation in daily temperatures has a very stable climate. A city with a high standard deviation experiences dramatic temperature swings throughout the year.
Sports Analytics Coaches and analysts apply the Standard Deviation Formula to measure consistency in athlete performance. A player with a low standard deviation in points scored is highly consistent; one with a high standard deviation is unpredictable — capable of both outstanding and poor performances.
Tips for Accurate Standard Deviation Calculations
Whether you are computing this by hand or using a calculator, these tips will help you get reliable results every time.
Identify Whether You Have a Population or a Sample First Before you start any calculation, decide clearly whether your dataset is the entire population or just a sample. This determines which version of the Standard Deviation Formula to apply and has a direct impact on your final result.
Check Your Data for Outliers Extreme outliers have a disproportionately large effect on standard deviation because deviations are squared. If an outlier is a genuine data error, correct or remove it before computing. If it is a real value, note that it significantly inflates the result.
Use Consistent Units All values in your dataset must be in the same unit of measurement. Mixing meters with centimeters, or kilograms with grams, will produce meaningless results regardless of how correctly you apply it.
Always Verify with a Second Method When precision matters, compute the result by hand and cross-check with the Statistics Calculator. Consistent results from two independent methods give you strong confidence in your answer.
Understand What the Number Means A standard deviation is only meaningful in context. A result of 5 is tiny if your data ranges from 0 to 10,000 — but large if your data ranges from 1 to 10. Always interpret it relative to the scale and nature of your dataset.
Common Mistakes to Avoid
Even experienced analysts make errors when working with standard deviation. Here are the most important mistakes to recognize and avoid.
Mistake 1 — Using Population Formula on a Sample This is the most frequent and consequential error. Using N instead of (n − 1) in a sample calculation produces a biased result that systematically underestimates the true population variability. Always confirm which denominator to use before applying the Standard Deviation Formula.
Mistake 2 — Forgetting to Square the Deviations Without squaring, positive and negative deviations cancel each other out, and the sum becomes zero. The squaring step is not optional — it is fundamental to how the Standard Deviation Formula works.
Mistake 3 — Confusing Standard Deviation with Variance Variance and standard deviation both measure data spread — but in different units. Variance is the squared standard deviation and is not in the original unit of your data. Standard deviation is in the original unit. Always take the square root to convert variance to standard deviation.
Mistake 4 — Interpreting Standard Deviation Without Context A standard deviation number alone is meaningless without knowing the scale of the data. Never report a standard deviation figure without also reporting the mean, so the reader can judge whether the spread is large or small relative to the average.
Mistake 5 — Using Standard Deviation for Non-Numeric Data The Standard Deviation Formula requires numeric, continuous data. It cannot be applied to categorical data like colors, names, or labels. Attempting to compute standard deviation on non-numeric data produces mathematically invalid results.Standard Deviation Formula
Frequently Asked Questions (FAQs)
What is the Standard Deviation Formula used for? The Standard Deviation Formula is used to measure how spread out the values in a dataset are around the mean. It is widely used in statistics, finance, science, engineering, education, and medicine to quantify variability and assess data consistency.
What is the difference between population and sample standard deviation? The population Standard Deviation Formula divides by N (total population count), while the sample version divides by (n − 1). The sample formula uses Bessel’s correction to produce an unbiased estimate of population standard deviation when only a subset of data is available.
When should I use standard deviation instead of variance? Use the Standard Deviation Formula whenever you want a result in the same unit as your original data. Variance is in squared units and is harder to interpret directly. Standard deviation is more intuitive because it is directly comparable to the original measurements.
Can standard deviation give a negative result? No. The Standard Deviation Formula always produces a zero or positive result. A standard deviation of zero means all values are identical. Any positive value indicates some degree of variability. A negative standard deviation is mathematically impossible.
How does the Statistics Calculator compute standard deviation? The Statistics Calculator applies this formula automatically. You enter your data, and the tool computes both the sample standard deviation (dividing by n − 1) and the population standard deviation (dividing by N), displaying both results side by side for easy comparison.
What is a good standard deviation value? There is no universally “good” or “bad” value. The result must always be interpreted relative to the mean and context. In quality control, smaller is usually better. In financial markets, higher values indicate more risk. In academic testing, moderate standard deviation often indicates a well-distributed assessment.
Is standard deviation the same as standard error? No. Standard deviation measures the spread of individual data points around the mean. Standard error measures how much the sample mean itself varies from the true population mean. The Standard Deviation Formula is a prerequisite for calculating standard error, which equals standard deviation divided by the square root of n.
Conclusion
The Standard Deviation Formula is one of the foundational building blocks of statistical analysis. It transforms a raw collection of numbers into a single, meaningful value that tells you exactly how consistent or variable your data is. From classroom test scores to stock market returns, from clinical trials to manufacturing quality checks — it is applied everywhere that data is measured and analyzed.
In this guide, we covered everything you need to know:
- What a Statistics Calculator is and the full range of metrics it computes
- What this formula means conceptually and mathematically
- The two types — population and sample — and when to use each
- A complete step-by-step worked example with a full calculations table
- What every component of the formula does and why it is there
- Real-world applications across finance, education, medicine, manufacturing, and more
- Tips for accurate calculations and common mistakes to avoid
- Answers to the most frequently asked questions
Whether you are a student learning statistics for the first time, a researcher analyzing experimental data, or a professional making data-driven decisions, the Standard Deviation Formula is an indispensable tool in your analytical toolkit.
Use the Statistics Calculator at the top of this page to compute standard deviation instantly from any dataset. Enter your numbers, read the results, and let the data tell its story with precision and clarity. Standard Deviation Formula