Solve long division instantly with our fast and easy Long Division Calculator
Table of Contents
- Introduction
- What is a P Value?
- Why Use a P Value Calculator?
- Understanding the Input Fields
- How the P Value Calculator Works
- Step-by-Step: Using the P Value Calculator
- Interpreting the Results
- One-Tailed vs Two-Tailed Tests
- Common Mistakes to Avoid
- Real-World Applications of a P Value Calculator
- P Value vs Confidence Interval
- Tips for Accurate Statistical Analysis
- Frequently Asked Questions
- Conclusion
Introduction
Statistics is the backbone of modern research, business analytics, medical studies, and quality control. Whether you are a student, researcher, data analyst, or business professional, you have probably come across the term “p-value” at some point. Calculating it manually can be time-consuming and error-prone, which is exactly why an online P Value Calculator is such a powerful tool.
This guide will walk you through everything you need to know about using a P Value Calculator, understanding its inputs, interpreting its outputs, and applying the results to real-world decision-making. By the end of this article, you will be able to confidently run hypothesis tests and draw statistically valid conclusions without struggling with complex formulas.
What is a P Value?
A p-value is a number between 0 and 1 that helps you determine the strength of evidence against a null hypothesis. In simple terms, it tells you how likely it is that the results you observed happened by random chance rather than because of a real effect.
- A small p-value (typically ≤ 0.05) indicates strong evidence against the null hypothesis.
- A large p-value (> 0.05) suggests weak evidence against the null hypothesis.
The P Value Calculator automates this entire computation, giving you instant, accurate results.
A P Value Calculator is an essential statistical tool that helps users determine the p-value of a hypothesis test quickly and accurately. In statistics, the p-value is used to measure the strength of evidence against a null hypothesis, making it one of the most important values in data analysis and research. Instead of manually performing lengthy calculations, a P Value Calculator automates the entire process and provides instant results along with detailed calculation steps.
Whether you are a student, researcher, scientist, analyst, or business professional, a P Value Calculator can simplify complex statistical testing and help you make data-driven decisions with confidence. The calculator uses key statistical inputs such as sample mean, standard deviation, sample size, null hypothesis mean, significance level (alpha), degrees of freedom, and confidence level to calculate the test statistic and estimate the corresponding p-value. This saves time, improves accuracy, and eliminates the risk of manual calculation errors.
The primary purpose of a P Value Calculator is to determine whether the observed results from a sample are statistically significant. In hypothesis testing, researchers typically begin with a null hypothesis that represents a default assumption. The p-value then indicates how likely the observed data would be if that assumption were true. A smaller p-value generally suggests stronger evidence against the null hypothesis, while a larger p-value indicates that the results may have occurred due to random chance.
Using a P Value Calculator is especially helpful because statistical calculations often involve multiple formulas, standard errors, test statistics, and probability distributions. Performing these calculations manually can be challenging, particularly for beginners. By automating the process, the calculator allows users to focus on interpreting the results rather than spending time on mathematical computations.
Another major advantage of a P Value Calculator is its educational value. The tool not only generates a final answer but also displays the formulas and step-by-step calculations used to reach the result. This helps students and learners understand the principles of hypothesis testing, statistical significance, confidence levels, and inferential statistics more effectively. As a result, the calculator serves as both a practical analysis tool and a learning resource.
A P Value Calculator is commonly used in scientific research, academic studies, medical testing, business analytics, quality control, market research, and experimental investigations. Whenever there is a need to determine whether a result is statistically meaningful, this calculator provides a fast and reliable solution. Researchers can use it to validate findings, analysts can use it to evaluate trends, and students can use it to solve statistics assignments more efficiently.
In today’s data-driven world, understanding statistical significance is crucial for making informed decisions. A P Value Calculator transforms a complex statistical process into a simple and user-friendly experience, enabling users to analyze data accurately and confidently. Whether you need to verify research findings, perform hypothesis testing, or learn the fundamentals of statistics, this P Value Calculator provides a quick, accurate, and effective way to calculate and interpret p-values.
Why Use a P Value Calculator?
Manually computing a p-value requires knowledge of t-distributions, z-distributions, and integration techniques. Most people don’t have time for that. Here’s why an online P Value Calculator is essential:
- Speed: Get answers in seconds, not hours.
- Accuracy: Eliminates human calculation errors.
- Accessibility: No need to install heavy statistical software like SPSS or R.
- Educational value: Many calculators show step-by-step working, making them ideal for learning.
- Versatility: Works for t-tests, z-tests, chi-square tests, and more.
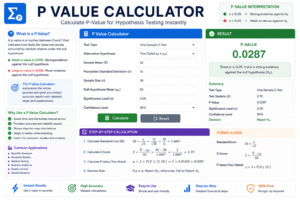
Understanding the Input Fields
Our calculator uses seven key inputs. Let’s break each one down:
1. Sample Mean (x̄) – The average value of your sample data.
2. Standard Deviation (σ or s) – Measures how spread out your data points are from the mean.
3. Sample Size (n) – The number of observations in your sample.
4. Null Hypothesis (μ₀) – The assumed population mean you are testing against.
5. Alpha Level (α) – The significance threshold, usually set at 0.05 or 0.01.
6. Degrees of Freedom (df) – Typically n − 1 for a one-sample t-test.
7. Confidence Level – Usually 95% or 99%, representing how sure you want to be.
How the P Value Calculator Works
The P Value Calculator uses the following general formula for a one-sample t-test:
t = (x̄ − μ₀) / (s / √n)
Once the t-statistic is computed, the calculator references the t-distribution table (based on your degrees of freedom) to find the corresponding p-value.
The tool then compares the p-value to your alpha level:
- If p ≤ α → Reject the null hypothesis (the result is statistically significant).
- If p > α → Fail to reject the null hypothesis (no significant evidence found).
Step-by-Step: Using the P Value Calculator
Follow these simple steps:
Step 1: Enter your Sample Mean into the first field.
Step 2: Add your Standard Deviation value.
Step 3: Input the Sample Size of your data.
Step 4: Type in the Null Hypothesis mean (μ₀).
Step 5: Choose your Alpha Level, commonly 0.05.
Step 6: Enter your Degrees of Freedom, typically n − 1.
Step 7: Select your Confidence Level, usually 95%.
Step 8: Click the Calculate button.
The tool will instantly display your t-statistic, p-value, and a clear conclusion about your hypothesis test.
Interpreting the Results
The results panel will display three crucial pieces of information:
- Test Statistic (t-value or z-value) – The standardized measure of your sample.
- P-Value – The probability associated with that statistic.
- Decision – Whether to reject or fail to reject the null hypothesis.
For example, if your p-value = 0.023 and your α = 0.05, you would reject the null hypothesis because 0.023 < 0.05. This means your results are statistically significant.
One-Tailed vs Two-Tailed Tests
Understanding tail direction is critical:
- One-Tailed Test: Used when you predict the effect will go in one specific direction (greater than OR less than).
- Two-Tailed Test: Used when you simply want to know if there is a difference, regardless of direction.
A good P Value Calculator will allow you to specify which type of test you’re running for maximum accuracy.
Common Mistakes to Avoid
When working with hypothesis testing, watch out for these common pitfalls:
- Confusing p-value with effect size – A small p-value does not mean a large effect.
- Misinterpreting “fail to reject” – It does not prove the null hypothesis is true.
- Using the wrong test – Make sure your data fits the assumptions of the test.
- Ignoring sample size – Very large samples can produce tiny p-values even for trivial effects.
- P-hacking – Running multiple tests until you find significance is bad practice.
Real-World Applications
The applications of statistical testing extend across nearly every industry:
- Medical Research: Testing whether a new drug outperforms a placebo.
- Marketing: A/B testing two website designs to see which performs better.
- Manufacturing: Determining if a production process meets quality standards.
- Finance: Evaluating whether an investment strategy beats the market.
- Education: Comparing the effectiveness of teaching methods.
- Agriculture: Testing if a new fertilizer increases crop yield.
In each of these scenarios, a quick P Value Calculator saves hours of manual work.
P Value vs Confidence Interval
Although they’re related, these two concepts serve different purposes:
- The p-value tells you whether an effect exists.
- The confidence interval tells you how large that effect likely is.
Together, they provide a complete picture of your data. Best practice is to report both in any research paper or business report.
Tips for Accurate Statistical Analysis
To get the most reliable results from your testing:
- Always double-check your inputs before clicking calculate.
- Use a sufficient sample size to ensure statistical power.
- Pick the appropriate test for your data type.
- Set your alpha level before collecting data, not after.
- Document everything for reproducibility.
- Combine the calculator’s output with domain expertise for the best decisions.
Frequently Asked Questions
Q1: Is a p-value of 0.05 always the right threshold? Not necessarily. Some fields use 0.01 or even 0.001 for stricter standards.
Q2: Can I use this for non-normal data? For non-normal distributions, consider non-parametric tests like Mann-Whitney U or Wilcoxon.
Q3: What does p = 0 mean? It means the probability is extremely small, essentially rounded down to zero — strong evidence against the null hypothesis.
Q4: Do I need degrees of freedom for a z-test? No. Degrees of freedom are only required for t-tests and chi-square tests.
Q5: Is this calculator free to use? Yes, our online tool is 100% free and requires no signup.
Conclusion
Hypothesis testing doesn’t have to be intimidating or complicated. With a reliable P Value Calculator at your fingertips, you can perform professional-grade statistical analysis in just a few clicks. Whether you’re conducting academic research, running A/B tests, or making business decisions, this tool empowers you to make data-driven choices with confidence.
Always remember that statistical significance is just one piece of the puzzle. Combine your calculator’s results with critical thinking, domain knowledge, and effect size analysis to draw the most meaningful conclusions from your data. Bookmark this P Value Calculator today and make it your go-to companion for all your statistical testing needs.