Calculate hexadecimal values instantly with our fast and accurate Hex Calculator
Table of Contents
- Introduction
- What Is a Confidence Interval Calculator?
- What Is the Confidence Interval Equation?
- Breaking Down Every Part of the Confidence Interval Equation
- Z-Score Values for Common Confidence Levels
- Standard Error – The Foundation of Every Confidence Interval
- Margin of Error Explained in Full
- How to Use a Confidence Interval Calculator Step by Step
- Interpreting Your Confidence Interval Results Correctly
- Real-Life Applications of the Confidence Interval Equation
- One-Sided vs Two-Sided Confidence Intervals
- Sample Size and Its Impact on the Confidence Interval Equation
- Tips for Using the Confidence Interval Equation Effectively
- Common Mistakes to Avoid
- Frequently Asked Questions (FAQs)
- Conclusion
Introduction
In the world of statistics, data analysis, scientific research, and business intelligence, no single concept is more central to drawing reliable conclusions from sample data than the confidence interval. A confidence interval tells you not just what a sample statistic is, but how confident you can be that it reflects the true value in the broader population. Understanding how to compute and interpret confidence intervals is a fundamental skill for anyone working with data — and the Confidence Interval Equation is the mathematical tool that makes this computation possible.
The Confidence Interval Equation transforms four pieces of information — a sample mean, a standard deviation, a sample size, and a desired confidence level — into a precise numerical range that, with a stated level of statistical certainty, contains the true population parameter. This equation is used in clinical trials, political polling, quality control manufacturing, financial analysis, academic research, and machine learning model evaluation — essentially everywhere that decisions must be made based on incomplete data.
In this comprehensive guide, we will walk you through everything you need to know about the Confidence Interval Equation — from its mathematical definition and components to its real-world applications, correct interpretation, and the common mistakes that even experienced analysts make. We will also show you how to use a digital confidence interval tool to apply the Confidence Interval Equation instantly and accurately, without needing to perform manual statistical calculations. By the end of this article, you will have a thorough and confident understanding of one of the most important concepts in all of applied statistics.
What Is a Confidence Interval Calculator?
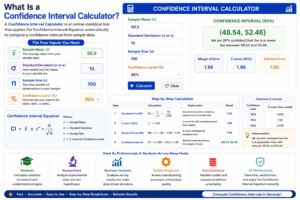
A Confidence Interval Calculator is an online statistical tool that applies the Confidence Interval Equation automatically to compute a confidence interval from sample data. Instead of manually working through the formula — calculating the standard error, looking up the z-score, multiplying, and performing the final addition and subtraction — you simply enter your four parameters and receive the complete result with a full step-by-step breakdown in seconds.
The four inputs required by a Confidence Interval Calculator are:
- Sample Mean (x̄) — the average value computed from your sample data
- Standard Deviation (σ or s) — a measure of how spread out the values in your sample are
- Sample Size (n) — the total number of observations in your sample
- Confidence Level (%) — typically 90%, 95%, or 99%, representing how certain you want to be that the true population mean falls within the interval
Once these four values are entered, the Confidence Interval Calculator applies the Confidence Interval Equation, computes the standard error, calculates the margin of error using the appropriate z-score, and displays the lower and upper bounds of the confidence interval — giving you the complete statistical range in a clear, readable format.
A reliable Confidence Interval Calculator is used by students completing statistics coursework, researchers analyzing experimental data, business analysts evaluating survey results, quality engineers assessing manufacturing output, and data scientists validating model predictions. In every one of these use cases, the tool saves time, eliminates arithmetic errors, and ensures that the Confidence Interval Equation is applied correctly every time.
What Is the Confidence Interval Equation?
The Confidence Interval Equation is the statistical formula used to calculate a range of values within which the true population parameter is expected to fall, given a specified level of confidence. It is one of the most widely taught and applied formulas in inferential statistics.
The standard Confidence Interval Equation for a population mean is:
CI = x̄ ± Z × (σ / √n)
Where:
- x̄ = the sample mean
- Z = the z-score corresponding to the chosen confidence level
- σ = the standard deviation of the sample (or population)
- n = the sample size
- √n = the square root of the sample size
- σ / √n = the Standard Error (SE)
- Z × SE = the Margin of Error (ME)
The output of the Confidence Interval Equation is a range: [x̄ − ME, x̄ + ME]
This range is the confidence interval. The lower bound is x̄ − ME and the upper bound is x̄ + ME. The interpretation is that if you repeated your sampling process many times and applied the Confidence Interval Equation each time, the resulting intervals would contain the true population mean a percentage of the time equal to your stated confidence level.
For example, at a 95% confidence level, approximately 95 out of every 100 intervals computed using the Confidence Interval Equation from repeated samples would contain the true population mean. This is the precise meaning of “95% confidence” — it refers to the long-run reliability of the interval estimation method, not the probability that a specific interval contains the true value.
Breaking Down Every Part of the Confidence Interval Equation
Understanding each component of the Confidence Interval Equation individually is essential for applying it correctly and interpreting results meaningfully.
Component 1 — The Sample Mean (x̄)
The sample mean is the arithmetic average of all values in your sample. It is computed by summing all observations and dividing by the number of observations. The sample mean is the center of the confidence interval — the lower and upper bounds are both calculated relative to this central value. The accuracy of the entire Confidence Interval Equation depends on having an unbiased, representative sample mean.
Component 2 — The Z-Score (Z)
The z-score is a critical value from the standard normal distribution that corresponds to your chosen confidence level. It determines how wide the interval will be. A higher confidence level requires a larger z-score, which produces a wider interval. For a 95% confidence level, the standard z-score is 1.96. For 90%, it is 1.645, and for 99%, it is 2.576. The z-score multiplies the standard error to produce the margin of error in the Confidence Interval Equation.
Component 3 — The Standard Deviation (σ or s)
The standard deviation measures the spread or variability of values in your dataset. A larger standard deviation indicates that individual data points are more spread out from the mean, which produces a wider confidence interval. A smaller standard deviation indicates more tightly clustered data and produces a narrower interval. In the Confidence Interval Equation, the standard deviation appears in the numerator of the standard error fraction.
Component 4 — The Sample Size (n)
The sample size is the total number of observations in your study. It appears under the square root in the denominator of the standard error fraction in the Confidence Interval Equation. Larger sample sizes reduce the standard error and narrow the confidence interval, making your estimate more precise. This is why large-scale studies produce tighter confidence intervals than small preliminary studies.
Component 5 — The Standard Error (SE = σ / √n)
The standard error is a measure of how much the sample mean is expected to vary from one random sample to the next. It is computed as the standard deviation divided by the square root of the sample size. A smaller standard error means your sample mean is a more reliable estimate of the population mean. The standard error is the denominator input into the margin of error step of the Confidence Interval Equation.
Component 6 — The Margin of Error (ME = Z × SE)
The margin of error is the half-width of the confidence interval. It is computed by multiplying the z-score by the standard error. The margin of error determines how wide or narrow the final interval will be. A smaller margin of error indicates a more precise estimate. The lower confidence interval bound is x̄ − ME and the upper bound is x̄ + ME, completing the Confidence Interval Equation.
Z-Score Values for Common Confidence Levels
The z-score is one of the most important inputs in the Confidence Interval Equation. Here is a complete reference table of the most commonly used confidence levels and their corresponding z-scores:
| Confidence Level | Z-Score (Two-Tailed) |
|---|---|
| 80% | 1.282 |
| 85% | 1.440 |
| 90% | 1.645 |
| 95% | 1.960 |
| 98% | 2.326 |
| 99% | 2.576 |
| 99.9% | 3.291 |
The 95% confidence level with z = 1.96 is by far the most widely used standard in academic research, clinical studies, and business analysis. It represents a strong level of statistical confidence while maintaining reasonably practical interval widths. The 99% level (z = 2.576) is used when the cost of being wrong is very high — for example, in pharmaceutical safety testing or aerospace engineering quality control.
Understanding how the z-score affects the Confidence Interval Equation helps you make informed decisions about which confidence level to choose for your specific analysis. A higher confidence level produces a wider, more conservative interval. A lower confidence level produces a narrower interval that may miss the true parameter value more often.
Standard Error – The Foundation of Every Confidence Interval
The Standard Error (SE) is arguably the most important intermediate value in the Confidence Interval Equation. It quantifies how precisely your sample mean estimates the true population mean and is computed as:
SE = σ / √n
How the standard error changes with sample size:
- If n = 4: SE = σ / 2
- If n = 25: SE = σ / 5
- If n = 100: SE = σ / 10
- If n = 400: SE = σ / 20
Notice that the standard error decreases as the sample size increases — but it decreases proportionally to the square root of n, not n itself. This means that to halve the standard error (and therefore halve the width of your confidence interval), you need to quadruple your sample size. This mathematical relationship — rooted in the square root law — has enormous practical implications for research design, clinical trial planning, and quality control sample sizing.
A large standard error means your sample mean is an imprecise estimate of the population mean, and the confidence interval will be wide. A small standard error means your sample mean is a highly reliable estimate, and the confidence interval will be narrow. The standard error is the single most important lever available to researchers for controlling the precision of the Confidence Interval Equation output.
Margin of Error Explained in Full
The Margin of Error (ME) is the amount added to and subtracted from the sample mean to create the upper and lower bounds of the confidence interval. It is computed as:
ME = Z × SE = Z × (σ / √n)
The margin of error determines the total width of the confidence interval — the wider the margin of error, the less precise the estimate. The total interval width equals 2 × ME.
Factors that affect the margin of error:
- Higher confidence level → larger z-score → larger ME → wider interval
- Larger sample size → smaller SE → smaller ME → narrower interval
- Larger standard deviation → larger SE → larger ME → wider interval
Worked example:
- Sample mean (x̄) = 50
- Standard deviation (σ) = 10
- Sample size (n) = 30
- Confidence level = 95% → z = 1.96
Step 1: SE = 10 / √30 = 10 / 5.477 = 1.826
Step 2: ME = 1.96 × 1.826 = 3.579
Step 3: Lower bound = 50 − 3.579 = 46.421
Step 4: Upper bound = 50 + 3.579 = 53.579
Result: The 95% Confidence Interval is [46.42, 53.58]
This means you can be 95% confident that the true population mean falls between 46.42 and 53.58. The entire Confidence Interval Equation — from standard error through margin of error to final bounds — is executed automatically by the calculator in one click.
How to Use a Confidence Interval Calculator Step by Step
Applying the Confidence Interval Equation manually involves multiple formula steps. A digital tool simplifies the entire process. Here is a complete guide:
Step One – Enter the Sample Mean
Type your computed sample mean into the Sample Mean field. This is the arithmetic average of all values in your dataset. This value becomes the center point of the confidence interval produced by the Confidence Interval Equation.
Step Two – Enter the Standard Deviation
Type the standard deviation of your sample into the Standard Deviation field. If you are working with population data, use the population standard deviation (σ). If you are working with sample data (which is more common), use the sample standard deviation (s). A higher standard deviation will produce a wider interval, reflecting greater variability in your data.
Step Three – Enter the Sample Size
Type the total number of observations in your sample into the Sample Size field. This value must be a positive integer greater than zero. A larger sample size reduces the standard error and narrows the confidence interval, reflecting the greater precision that comes from having more data.
Step Four – Enter the Confidence Level
Type your desired confidence level as a percentage — for example, 95 for 95% confidence, 99 for 99% confidence, or 90 for 90% confidence. The calculator maps this input to the appropriate z-score and applies it in the Confidence Interval Equation.
Step Five – Click Calculate
Press the “Calculate” button. The tool instantly computes the standard error, the margin of error, and the lower and upper bounds of the confidence interval — displaying all three intermediate steps so you can see exactly how the Confidence Interval Equation was applied to your specific inputs.
Step Six – Review the Full Step-by-Step Output
Study the intermediate steps, not just the final interval. The output shows SE, ME, and the final range. Cross-checking these values against your own calculations confirms that your inputs were entered correctly and that the formula was applied as expected.
Step Seven – Clear and Recalculate
Press “Clear” to reset all fields and the results panel. This ensures no residual values from a previous calculation affect your next one.
Interpreting Your Confidence Interval Results Correctly
One of the most common sources of error in statistics is misinterpreting what a confidence interval means. Here is the precise, correct interpretation:
Correct interpretation: “We are 95% confident that the true population mean falls within the interval [46.42, 53.58].”
This does NOT mean: “There is a 95% probability that the true mean is between 46.42 and 53.58.” The true mean is a fixed (though unknown) value — it either is or is not inside the interval. The 95% refers to the long-run proportion of intervals that would contain the true mean if the sampling and calculation process were repeated many times.
What a narrow confidence interval tells you:
- Your sample size is large, or
- Your data has low variability, or
- You chose a lower confidence level
- Result: More precise estimate
What a wide confidence interval tells you:
- Your sample size is small, or
- Your data has high variability, or
- You chose a higher confidence level
- Result: Less precise estimate — consider increasing sample size
Understanding these interpretations is as important as computing the Confidence Interval Equation itself. The numerical bounds are meaningless without a correct understanding of what they actually represent statistically.
Real-Life Applications of the Confidence Interval Equation
The Confidence Interval Equation is applied across a remarkable breadth of professional fields wherever decisions must be made based on sample data rather than complete population data:
Medical and Clinical Research
Every clinical drug trial reports confidence intervals for treatment effects. For example, a new blood pressure medication might reduce systolic blood pressure by a mean of 12 mmHg with a 95% confidence interval of [9.5, 14.5]. The Confidence Interval Equation tells physicians and regulators how precisely the treatment effect has been measured and whether the effect is likely to be clinically significant across the broader patient population.
Political Opinion Polling
Election polls always report a margin of error, which is precisely the ME component of the Confidence Interval Equation. A poll reporting “Candidate A has 52% support, ± 3%” has applied the confidence interval formula to compute that margin. The confidence interval tells voters and analysts how much uncertainty exists in the estimate and whether the lead is statistically meaningful or within the margin of variability.
Manufacturing Quality Control
Production engineers use confidence intervals to monitor manufacturing processes. If a machine is producing bolts with a target diameter of 10mm, quality engineers sample batches, compute the sample mean diameter, and apply the Confidence Interval Equation to determine whether the process is producing within acceptable tolerances. Intervals that fall outside the specification range trigger process adjustments.
Financial Analysis and Risk Management
Financial analysts use confidence intervals to estimate expected investment returns, value-at-risk (VaR) measures, and economic forecasting ranges. The Confidence Interval Equation quantifies the uncertainty around financial projections, giving risk managers a principled framework for decision-making under uncertainty rather than relying on single-point estimates.
Psychological and Social Science Research
Academic researchers in psychology, sociology, and education use confidence intervals in virtually every published study to report the precision of their estimated effects. Journals increasingly require researchers to report confidence intervals alongside p-values, because intervals convey both the direction and the precision of an effect — information that a simple pass/fail significance test cannot provide.
Machine Learning Model Evaluation
Data scientists use confidence intervals to report the precision of model accuracy metrics. Instead of reporting “this model has 87% accuracy,” a rigorous evaluation would report “this model has 87% accuracy with a 95% confidence interval of [84.2%, 89.8%]” — conveying the uncertainty that results from evaluating on a finite test set. The Confidence Interval Equation is directly applicable to these evaluation contexts.
One-Sided vs Two-Sided Confidence Intervals
There are two types of confidence intervals, and choosing the right one depends on your research question:
Two-Sided (Two-Tailed) Confidence Interval
This is the standard form of the Confidence Interval Equation that produces both a lower and upper bound: [x̄ − ME, x̄ + ME]. It is used when you are interested in both directions of deviation from the mean — for example, when testing whether a treatment has any effect (either positive or negative). The 95% two-sided interval uses z = 1.96.
One-Sided (One-Tailed) Confidence Interval
A one-sided interval produces only one bound — either a lower bound (x̄ − ME) or an upper bound (x̄ + ME). It is used when you are only concerned with deviation in one direction — for example, when testing whether a drug produces a minimum therapeutic effect, regardless of how large the effect might be. The 95% one-sided interval uses z = 1.645, which is the same z-value as the two-sided 90% interval.
Most standard applications of the Confidence Interval Equation use the two-sided form, and the z = 1.96 value for 95% confidence is the default assumption in most online calculators and statistical software. If your research question specifically requires a one-sided interval, adjust the z-score accordingly.
Sample Size and Its Impact on the Confidence Interval Equation
Sample size is the most powerful lever you have for controlling the precision of your confidence interval. Because n appears under a square root in the Confidence Interval Equation, its effect on interval width follows the square root law:
- n = 25 → SE = σ/5 → ME = 1.96 × σ/5
- n = 100 → SE = σ/10 → ME = 1.96 × σ/10 (interval width halved)
- n = 400 → SE = σ/20 → ME = 1.96 × σ/20 (interval width quartered)
To halve the margin of error, you must quadruple the sample size. This mathematical relationship has critical implications for research planning. Before collecting data, researchers and analysts can use the Confidence Interval Equation in reverse — solving for n — to determine the minimum sample size needed to achieve a target margin of error at a desired confidence level.
The minimum sample size formula is:
n = (Z × σ / ME)²
For example, if you want a margin of error no larger than 3 at 95% confidence, and your expected standard deviation is 15:
n = (1.96 × 15 / 3)² = (9.8)² ≈ 97 observations minimum
Planning your sample size using the Confidence Interval Equation before data collection is far more efficient than discovering after the fact that your interval is too wide to support any meaningful conclusions.
Tips for Using the Confidence Interval Equation Effectively
To get the most accurate and meaningful results every time you apply the Confidence Interval Equation, keep these professional tips in mind:
- Always verify that your sample is random and representative. The Confidence Interval Equation assumes random sampling. A biased or non-representative sample will produce a confidence interval that does not actually cover the true population parameter with the stated frequency.
- Use the correct standard deviation. Use the sample standard deviation (s) — not the population standard deviation — when working with sample data. For large samples (n > 30), the difference is small, but for small samples it matters significantly.
- Check your sample size before interpreting the interval. For small samples (n < 30), the z-distribution may not be appropriate, and the t-distribution should be used instead. The standard Confidence Interval Equation with z = 1.96 is most reliable for large samples.
- Report the interval alongside the point estimate. Never report only the confidence interval bounds without also stating the sample mean. Readers need the central estimate as well as the range of uncertainty.
- Do not interpret overlap of confidence intervals as a test of statistical significance. While non-overlapping intervals generally indicate a significant difference, overlapping intervals do not necessarily indicate non-significance. Proper significance testing requires a dedicated hypothesis test rather than visual inspection of intervals.
- Consider your confidence level choice deliberately. Higher confidence (99%) makes the interval wider and more conservative. Lower confidence (90%) produces a tighter interval but with greater risk of missing the true parameter. The choice should reflect the stakes of the decision and the cost of being wrong.
Common Mistakes to Avoid
Even experienced analysts make errors when applying or interpreting the Confidence Interval Equation. Here are the most important mistakes to recognize and prevent:
Mistake 1 — Misinterpreting the Confidence Level as a Probability
The most common error is stating “there is a 95% probability that the true mean falls within this interval.” This is incorrect. The true mean is fixed — it is either inside or outside the interval. The 95% refers to the long-run coverage frequency of the method, not the probability for a specific interval. The correct statement is: “We are 95% confident the interval contains the true mean.”
Mistake 2 — Using z-Scores for Small Samples
The standard Confidence Interval Equation with z = 1.96 assumes a large sample size (typically n ≥ 30). For smaller samples where the population standard deviation is unknown, you must use the t-distribution with n−1 degrees of freedom. Using z = 1.96 on a sample of 10 observations will produce an interval that is too narrow and overconfident.
Mistake 3 — Confusing Standard Deviation with Standard Error
Standard deviation (σ) and standard error (SE) are different values. The standard deviation measures the spread of individual data points around the mean. The standard error measures the precision of the sample mean as an estimate of the population mean. In the Confidence Interval Equation, it is the standard error (σ/√n) — not the raw standard deviation — that is multiplied by the z-score.
Mistake 4 — Using a Non-Representative Sample
The entire statistical validity of the Confidence Interval Equation depends on having a truly random, representative sample. If your sample is biased — for example, if you only surveyed respondents who volunteered, or collected data from a non-random subset of the population — the resulting confidence interval may be mathematically precise but statistically meaningless. Garbage in, garbage out applies fully to confidence interval estimation.
Mistake 5 — Ignoring the Effect of Sample Size on Interval Width
Many analysts accept wide confidence intervals without recognizing that increasing the sample size could dramatically narrow them. Understanding the square root relationship between n and interval width allows you to plan studies more effectively and draw more precise conclusions from the Confidence Interval Equation.
Frequently Asked Questions (FAQs)
What is the Confidence Interval Equation and what does it calculate?
The Confidence Interval Equation is the statistical formula CI = x̄ ± Z × (σ / √n) that computes a range of values within which the true population mean is expected to fall at a specified level of statistical confidence. It combines the sample mean, standard deviation, sample size, and a z-score to produce a lower and upper bound that quantifies the uncertainty of a sample-based estimate.
What does 95% confidence actually mean in the Confidence Interval Equation?
A 95% confidence level means that if you repeated the sampling process and applied the Confidence Interval Equation many times, approximately 95% of the resulting intervals would contain the true population mean. It does not mean that there is a 95% probability that any specific interval contains the true value — the true value is fixed, and the interval either covers it or it does not.
What z-score should I use in the Confidence Interval Equation for 95% confidence?
The standard z-score for a 95% two-sided confidence interval is z = 1.96. This value comes from the standard normal distribution and reflects the fact that 95% of the probability mass falls within ±1.96 standard deviations of the mean. For 99% confidence, use z = 2.576. For 90% confidence, use z = 1.645.
How does increasing the sample size affect the Confidence Interval Equation output?
Increasing the sample size (n) reduces the standard error (SE = σ/√n) and therefore reduces the margin of error (ME = Z × SE), producing a narrower confidence interval. The relationship follows the square root law — quadrupling the sample size halves the margin of error. Larger samples always produce more precise confidence intervals when all other factors remain constant.
When should I use the t-distribution instead of the z-score in the Confidence Interval Equation?
Use the t-distribution when your sample size is small (typically n < 30) and the population standard deviation is unknown. For large samples (n ≥ 30), the z-distribution and t-distribution produce nearly identical results, and the Confidence Interval Equation with z = 1.96 is a reliable approximation. The t-distribution accounts for the additional uncertainty introduced by estimating the population standard deviation from the sample itself.
Can the Confidence Interval Equation be used for proportions as well as means?
Yes. For population proportions (such as the proportion of voters supporting a candidate), the Confidence Interval Equation is adapted as: CI = p ± Z × √(p(1-p)/n), where p is the sample proportion. This is the form of the equation used in political polling to compute the margin of error for survey results.
Is a narrower confidence interval always better?
Not necessarily. A narrower confidence interval indicates a more precise estimate, which is generally desirable. However, achieving a narrow interval by using a low confidence level (e.g., 80%) means the interval is more likely to miss the true population parameter. The ideal confidence interval is as narrow as possible while still using a confidence level appropriate to the stakes of the decision — typically 95% for most research and business applications.
What is the difference between confidence interval and margin of error?
The margin of error (ME) is the half-width of the confidence interval — it is the amount added to and subtracted from the sample mean to produce the interval bounds. The confidence interval is the complete range: [x̄ − ME, x̄ + ME]. In everyday reporting (such as polling), “margin of error” refers to the ME value, and understanding its relationship to the full interval is key to interpreting survey results correctly.
Conclusion
The Confidence Interval Equation is one of the most powerful and broadly applied formulas in all of statistics. It transforms raw sample data into a principled, quantified statement of uncertainty — telling you not just what the data shows, but how precisely and reliably it reflects the broader population from which it was drawn. Mastering the Confidence Interval Equation is essential for anyone working in research, data science, engineering, finance, medicine, or any other field where evidence-based decisions must be made from incomplete information.
From clinical drug trials to political polls, from manufacturing quality control to machine learning model evaluation, the Confidence Interval Equation provides the statistical vocabulary and mathematical framework for expressing the precision of estimates and the reliability of conclusions. Without it, data analysis produces point estimates that give the illusion of precision while concealing the very uncertainty that decision-makers most need to understand.
The digital tools that apply the Confidence Interval Equation automatically — computing the standard error, applying the z-score, calculating the margin of error, and displaying the final interval bounds with full step-by-step working — make this powerful formula accessible to everyone, regardless of their mathematical background. Whether you are computing a confidence interval for the first time as a student or applying it to a professional research study, these tools give you the speed, accuracy, and transparency to work with the Confidence Interval Equation confidently and efficiently every time. Use them well, understand the results they produce, and let the precision of statistical confidence elevate the quality and credibility of every analysis you undertake.