Use the easy Mean Median Mode Range Calculator now
Table of Contents
- Introduction
- What Is a Z Score?
- What Is a Z Score Calculator?
- The Z Score Formula Explained
- How to Use the Z Score Calculator Step by Step
- Understanding Your Z Score Results
- Z Score and the Normal Distribution
- Applications of the Z Score Calculator in Real Life
- Z Score Calculator in Education
- Z Score Calculator in Finance and Business
- Z Score Calculator in Medical and Scientific Research
- Z Score vs T Score — Key Differences
- Common Mistakes When Using a Z Score Calculator
- Benefits of Using an Online Z Score Calculator
- Tips for Getting Accurate Results
- Frequently Asked Questions (FAQs)
- Conclusion
Introduction
In the world of statistics and data analysis, one tool stands out for its simplicity and power — the Z Score Calculator. Whether you are a student trying to understand your exam performance, a researcher analyzing scientific data, or a business professional making data-driven decisions, the Z Score Calculator is an essential instrument in your toolkit. It allows you to quickly determine how far a particular value deviates from the average, expressed in units of standard deviation. In this comprehensive guide, we will walk you through everything you need to know about the Z
Score Calculator — from its basic definition and formula to its real-world applications and interpretation of results. By the end of this article, you will have a thorough understanding of how to use this powerful statistical tool to your advantage.
What Is a Z Score?
A Z Score, also known as a standard score, is a numerical measurement that describes a value’s relationship to the mean of a group of values. A Z Score tells you how many standard deviations a particular data point is above or below the mean. When a Z Score is zero, it means the data point is exactly equal to the mean. A positive Z Score indicates the value is above the mean, while a negative Z Score shows the value is below the mean.
For example, if a student scores 85 on a test where the average score is 75 and the standard deviation is 5, the Z Score would be +2.0. This means the student performed two standard deviations above the average, placing them in the top tier of performers.
Understanding Z Scores is fundamental to statistical analysis, hypothesis testing, and probability calculations. Without this concept, comparing data points from different datasets or distributions would be extremely difficult.
What Is a Z Score Calculator?
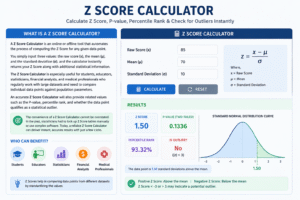
A Z Score Calculator is an online or offline tool that automates the process of computing the Z Score for any given data point. Instead of manually applying the formula — which requires subtraction and division — the Z Score Calculator does all the heavy lifting for you in seconds. You simply input three values: the raw score (x), the mean (μ), and the standard deviation (σ), and the calculator instantly returns your Z Score along with additional statistical information.
The Z Score Calculator is especially useful for students, educators, statisticians, financial analysts, and medical professionals who regularly work with large datasets and need to compare individual data points against population parameters. An accurate Z Score Calculator will also provide related values such as the P-value, percentile rank, and whether the data point qualifies as a statistical outlier.
The convenience of a Z Score Calculator cannot be overstated. In the past, statisticians had to look up Z Score tables manually or use complex software. Today, a reliable Z Score Calculator can deliver instant, accurate results with just a few clicks.
The Z Score Formula Explained
The foundation of every Z Score Calculator is the Z Score formula. The formula is straightforward:
Z = (X − μ) / σ
Where:
- X = the raw score or individual data point
- μ (mu) = the mean (average) of the population or dataset
- σ (sigma) = the standard deviation of the population or dataset
Breaking it down:
- (X − μ) calculates how far the raw score deviates from the mean. This is called the deviation score.
- Dividing by σ standardizes this deviation by expressing it in units of standard deviation.
The result is a dimensionless number — the Z Score — which can be compared across different datasets regardless of their original units or scales. This standardization is what makes the Z Score Calculator such a universally valuable tool.
For instance:
- A Z Score of 0 = the value equals the mean
- A Z Score of +1 = the value is one standard deviation above the mean
- A Z Score of −1 = the value is one standard deviation below the mean
- A Z Score of +2 or higher = the value may be considered a statistical outlier
How to Use the Z Score Calculator Step by Step
Using a Z Score Calculator is simple and requires no prior statistical expertise. Follow these steps:
Step 1 — Gather Your Data Identify the three values you need: the raw score (X), the population mean (μ), and the standard deviation (σ). Make sure these values are accurate, as incorrect inputs will lead to incorrect results.
Step 2 — Enter the Values Input the raw score, mean, and standard deviation into the designated fields of the Z Score Calculator.
Step 3 — Click Calculate Press the “Calculate” button. The Z Score Calculator will instantly process your inputs and return the Z Score.
Step 4 — Interpret the Results Review the output. A good Z Score Calculator will show not just the Z Score but also the deviation from the mean, whether the value is an outlier, and related probability information.
Step 5 — Apply the Results Use the Z Score in your analysis — whether for grading, quality control, research, or financial modeling.
Understanding Your Z Score Results
Once you use the Z Score Calculator, you need to interpret the results correctly. Here is a general guide:
| Z Score Range | Interpretation |
|---|---|
| Z = 0 | Exactly at the mean |
| 0 < Z < 1 | Slightly above average |
| 1 ≤ Z < 2 | Moderately above average |
| Z ≥ 2 | Significantly above average (possible outlier) |
| −1 < Z < 0 | Slightly below average |
| −2 < Z ≤ −1 | Moderately below average |
| Z ≤ −2 | Significantly below average (possible outlier) |
Most statisticians consider values with |Z| > 2 or |Z| > 3 to be outliers. This is important in quality control, where identifying anomalies in production data can prevent costly errors.
Z Score and the Normal Distribution
The Z Score Calculator is deeply tied to the concept of the normal distribution — the famous bell-shaped curve that describes how data naturally spreads in many real-world scenarios.
In a normal distribution:
- 68% of all values fall within ±1 standard deviation from the mean (Z Score between −1 and +1)
- 95% of all values fall within ±2 standard deviations (Z Score between −2 and +2)
- 99.7% of all values fall within ±3 standard deviations (Z Score between −3 and +3)
This is known as the 68-95-99.7 rule or the Empirical Rule. The Z Score Calculator leverages this relationship to provide probability values and percentile rankings. When you input your data into the Z Score Calculator and receive a result of Z = 1.5, it means approximately 93.3% of the population scores below that point.
Applications of the Z Score Calculator in Real Life
The Z Score Calculator is not just an academic exercise — it has practical applications across many industries and disciplines.
Quality Control in Manufacturing Factories and production facilities use the Z Score Calculator to monitor product dimensions and properties. Any measurement that falls outside a Z Score range of ±3 is flagged as a defect, helping companies maintain consistent quality standards.
Sports Performance Analysis Coaches and sports scientists apply the Z Score Calculator to compare athlete performance metrics. By standardizing scores, they can fairly compare players from different leagues, seasons, or demographic groups.
Psychology and Behavioral Research Researchers use the Z Score Calculator to normalize test scores and psychometric measurements, ensuring that results from different assessment tools can be meaningfully compared.
Z Score Calculator in Education
One of the most common uses of the Z Score Calculator is in the field of education. Teachers, professors, and testing organizations routinely use Z Scores to standardize exam results and rank student performance relative to their peers.
For example, if a class of 100 students takes an exam with a mean score of 70 and a standard deviation of 10, a student who scored 90 would have a Z Score of +2.0 — placing them in approximately the top 2.3% of the class. This kind of relative ranking is impossible without the Z Score Calculator.
Standardized tests like the SAT, GRE, GMAT, and IQ tests all use Z Score methodology to convert raw scores into standardized scores, making it possible to compare performance across different test versions and years.
Z Score Calculator in Finance and Business
In the financial world, the Z Score Calculator plays a critical role in risk assessment and investment analysis. The Altman Z Score, for instance, is a widely used formula that predicts the probability of a company going bankrupt within two years. Financial analysts and credit officers regularly use a Z Score Calculator to assess the financial health of companies by analyzing metrics like working capital, retained earnings, and sales revenue.
Portfolio managers also use Z Scores to identify which stocks or assets are performing significantly above or below historical norms — which can signal trading opportunities or risks.
Z Score Calculator in Medical and Scientific Research
Medical researchers rely on the Z Score Calculator to interpret clinical data. In pediatrics, Z Scores are used to assess children’s growth — comparing height, weight, and BMI against age-specific population norms. A child whose height has a Z Score of −2.0 or lower may be flagged for growth delay and evaluated by a physician.
In drug trials and clinical studies, the Z Score Calculator is used to determine whether differences between treatment and control groups are statistically significant. A Z Score leading to a P-value below 0.05 is generally considered statistically significant, meaning the observed effect is unlikely to be due to chance.
Z Score vs T Score — Key Differences
Many people confuse Z Scores with T Scores. While both are standardized measures, they are used in different situations:
| Feature | Z Score | T Score |
|---|---|---|
| Sample size | Large (n > 30) | Small (n < 30) |
| Population SD | Known | Unknown |
| Distribution | Standard normal | T-distribution |
| Best for | Population data | Sample data |
The Z Score Calculator is most appropriate when you have a large sample size and know the population standard deviation. When working with small samples or unknown population parameters, a T-test is more appropriate.
Common Mistakes When Using a Z Score Calculator
Even with a reliable Z Score Calculator, users can make errors that lead to incorrect conclusions. Here are the most common mistakes to avoid:
- Using sample standard deviation instead of population standard deviation — These are different calculations, and confusing them leads to incorrect Z Scores.
- Entering incorrect mean values — Always double-check that your mean corresponds to the same dataset as your raw score.
- Misinterpreting negative Z Scores — A negative Z Score simply means the value is below the mean — it does not mean the result is “bad” or “wrong.”
- Ignoring context — A Z Score of +2.5 in one field may have a completely different practical implication than in another field.
Benefits of Using an Online Z Score Calculator
An online Z Score Calculator offers numerous advantages over manual computation:
Speed and Efficiency The Z Score Calculator delivers instant results, saving you the time required for manual calculation — especially valuable when processing large datasets.
Accuracy Human calculation is prone to arithmetic errors. A digital Z Score Calculator eliminates this risk by automating every step of the formula.
Additional Statistical Outputs Many online tools provide not just the Z Score but also P-values, percentile ranks, confidence intervals, and outlier detection — giving you a fuller picture of your data.
Accessibility An online Z Score Calculator is available 24/7, requires no software installation, and can be used on any device — desktop, tablet, or smartphone.

Tips for Getting Accurate Results
To maximize the accuracy of your Z Score Calculator results:
- Always use the correct mean — ensure the mean is calculated from the same population you are comparing to
- Verify your standard deviation — distinguish between population SD (σ) and sample SD (s)
- Input exact values — avoid rounding intermediate values before entering them into the calculator
- Validate with multiple data points — use the Z Score Calculator on several values to spot trends and patterns
- Understand the context — Z Scores are most meaningful when the underlying data follows a normal distribution
Frequently Asked Questions (FAQs)
What is a Z Score Calculator used for? A Z Score Calculator is used to determine how many standard deviations a particular data point is from the mean of a dataset. It is widely used in statistics, education, finance, medicine, and scientific research.
Is a Z Score of 2.0 good or bad? A Z Score of +2.0 means the value is two standard deviations above the mean, which typically places it in the top 2.3% of the distribution. Whether this is “good” or “bad” depends entirely on the context. In an exam setting, it’s excellent. In blood pressure readings, it might indicate a health concern.
Can a Z Score be negative? Yes. A negative Z Score simply means the value is below the mean. For example, a Z Score of −1.5 indicates the value is 1.5 standard deviations below average.
What does a Z Score of 0 mean? A Z Score of 0 means the data point is exactly equal to the mean of the dataset.
How many decimal places should I use in a Z Score Calculator? Most statistical applications use Z Scores rounded to two decimal places (e.g., 1.96, 2.33). For more precise work, four decimal places may be used.
What is the difference between a Z Score and a percentile? A Z Score tells you how many standard deviations from the mean a value falls. A percentile tells you what percentage of the population scored below that value. A Z Score Calculator can convert between these two measures using the standard normal distribution table.
Can I use a Z Score Calculator for small samples? While you technically can, Z Scores are most accurate with large samples (n > 30) and known population standard deviations. For small samples, use a T-test instead.
Is a Z Score the same as a standard score? Yes. Z Score and standard score are terms used interchangeably in statistics.
How accurate is an online Z Score Calculator? A properly built online Z Score Calculator is extremely accurate — it applies the exact formula without rounding errors, making it more reliable than manual calculation.
What Z Score corresponds to a 95% confidence level? A Z Score of ±1.96 corresponds to a 95% confidence level. This is one of the most commonly used values in hypothesis testing and confidence interval calculations.
Conclusion
The Z Score Calculator is one of the most versatile and powerful tools in the field of statistics. From evaluating student performance and assessing financial risk to conducting medical research and quality control in manufacturing, the applications of the Z Score Calculator span virtually every discipline that deals with data.
By understanding the Z Score formula — Z = (X − μ) / σ — and knowing how to interpret the results, you gain a powerful ability to contextualize any data point within a broader distribution. The convenience of an online Z Score Calculator makes this process faster, more accurate, and accessible to everyone — from seasoned statisticians to curious students.
Whether you are comparing test scores, analyzing investment portfolios, monitoring patient health metrics, or evaluating production quality, the Z Score Calculator gives you a clear, standardized perspective on your data. It removes ambiguity and replaces it with statistical clarity.
We hope this comprehensive guide has given you the knowledge and confidence to use the Z Score Calculator effectively in your personal and professional life. Bookmark this page, practice with your own data, and let the power of standardized statistics work for you.