Calculate area instantly with our fast and accurate Area Calculator.
Table of Contents
- Introduction
- What Is Descriptive Statistics?
- What Is the Mean, Median, Mode, Range Calculator?
- What Is the Mean? Formula and Examples
- What Is the Median? Formula and Examples
- What Is the Mode? Formula and Examples
- What Is the Range? Formula and Examples
- Geometric Mean — An Extra Statistical Insight
- How to Use the Mean, Median, Mode, Range Calculator Step by Step
- Understanding the Full Output of the Calculator
- When to Use Mean vs. Median vs. Mode
- Mean, Median, Mode, Range Calculator in Education
- Mean, Median, Mode, Range Calculator in Business and Finance
- Mean, Median, Mode, Range Calculator in Science and Research
- Mean, Median, Mode, Range Calculator in Healthcare
- Common Mistakes When Interpreting Descriptive Statistics
- Frequently Asked Questions (FAQs)
- Conclusion
Introduction
Statistics is the language of data, and descriptive statistics are its most fundamental vocabulary. Whether you are analyzing test scores, tracking sales figures, evaluating survey responses, or studying scientific measurements, four key values define the character of any dataset: the mean, the median, the mode, and the range. Together, these four measures give you a powerful summary of what your data looks like — where it centers, how it spreads, and which values appear most frequently. The Mean, Median, Mode, Range Calculator is the digital tool that automates all four calculations at once, giving you instant, accurate, and comprehensive descriptive statistics from any set of numbers you provide.
This guide is your complete resource for understanding and using the Mean, Median, Mode, Range Calculator effectively. We will explain what each statistical measure means, how it is calculated, why it matters, and where it is used in the real world. We will also walk you through practical examples, explore common applications across different fields, highlight frequent mistakes, and answer the most common questions users have about this essential statistical tool. By the end, you will have everything you need to use the Mean, Median, Mode, Range Calculator with full confidence and understanding.
What Is Descriptive Statistics?
Descriptive statistics is the branch of statistics that summarizes and describes the main features of a dataset. Unlike inferential statistics, which draws conclusions about a larger population from a sample, descriptive statistics focuses on presenting and organizing data in a meaningful way — without making predictions or generalizations beyond the data itself.
The four pillars of descriptive statistics — mean, median, mode, and range — are the building blocks of virtually every statistical analysis. Understanding these four values gives you an immediate, intuitive picture of any dataset, answering the questions: What is the typical value? Where is the center? How spread out are the values? Which value appears most often?
The Mean, Median, Mode, Range Calculator is designed to answer all four questions simultaneously, making it the most efficient starting point for any descriptive data analysis.
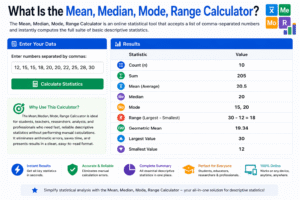
What Is the Mean, Median, Mode, Range Calculator?
The Mean, Median, Mode, Range Calculator is an online statistical tool that accepts a list of comma-separated numbers and instantly computes the full suite of basic descriptive statistics. Rather than calculating each measure separately, the Mean, Median, Mode, Range Calculator processes your entire dataset at once and returns a comprehensive results table that includes:
- Count — the total number of values in the dataset
- Sum — the total of all values added together
- Mean — the arithmetic average
- Median — the middle value when sorted
- Mode — the most frequently occurring value(s)
- Range — the difference between the largest and smallest values
- Geometric Mean — the nth root of the product of all values
- Largest and Smallest values — the maximum and minimum of the dataset
The Mean, Median, Mode, Range Calculator is ideal for students, teachers, researchers, analysts, and professionals who need fast, reliable descriptive statistics without performing manual calculations. It eliminates arithmetic errors, saves time, and presents results in a clean, easy-to-read format.
What Is the Mean? Formula and Examples
The mean is the arithmetic average of a dataset — the single most widely used measure of central tendency in statistics. It is calculated by dividing the sum of all values by the count of values.
Formula:
Mean = Sum of All Values / Count of Values
Example: Dataset: 10, 20, 30, 40, 50 Sum = 150 Count = 5 Mean = 150 / 5 = 30
The mean is highly sensitive to extreme values (outliers). A single unusually large or small number can pull the mean significantly away from the center of the majority of the data. For example, in the dataset 10, 12, 11, 13, 500 — the mean is 109.2, which does not represent any of the actual values well.
This is why the Mean, Median, Mode, Range Calculator provides all four measures — so you can compare the mean against the median and determine whether outliers are distorting your central tendency estimate.
What Is the Median? Formula and Examples
The median is the middle value of a dataset when all values are arranged in ascending or descending order. It divides the dataset into two equal halves — 50% of values fall below the median and 50% fall above.
For an odd number of values:
Median = The middle value
For an even number of values:
Median = (Middle Left Value + Middle Right Value) / 2
Example 1 — Odd Count: Sorted dataset: 5, 10, 15, 20, 25 Median = 15
Example 2 — Even Count: Sorted dataset: 5, 10, 15, 20, 25, 30 Median = (15 + 20) / 2 = 17.5
The median is resistant to outliers, making it a more reliable measure of the center when a dataset contains extreme values. For example, in real estate, median home prices are reported rather than mean prices — because a few exceptionally expensive homes would inflate the mean and give a misleading impression of what a “typical” home costs.
The Mean, Median, Mode, Range Calculator automatically sorts your data and computes the median accurately, regardless of how many values you enter.
What Is the Mode? Formula and Examples
The mode is the value that appears most frequently in a dataset. It is the only measure of central tendency that can be used with categorical (non-numerical) data, and it is especially useful for identifying the most common outcome in a distribution.
A dataset can have:
- One mode (unimodal) — one value appears more than all others
- Two modes (bimodal) — two values tie for the highest frequency
- Multiple modes (multimodal) — three or more values share the highest frequency
- No mode — all values appear exactly once
Example: Dataset: 4, 7, 7, 9, 11, 11, 11, 15 Frequencies: 4→1, 7→2, 9→1, 11→3, 15→1 Mode = 11 (appears 3 times)
The mode is particularly valuable in business and marketing. For example, a clothing retailer analyzing which shirt size sells most frequently uses the mode — not the mean or median — to inform inventory decisions.
The Mean, Median, Mode, Range Calculator identifies all modes automatically, including bimodal and multimodal cases, and displays “None” when all values are unique.
What Is the Range? Formula and Examples
The range is the simplest measure of variability (spread) in a dataset. It tells you the total span of your data — from the smallest value to the largest.
Formula:
Range = Largest Value − Smallest Value
Example: Dataset: 5, 12, 18, 24, 31 Largest = 31, Smallest = 5 Range = 31 − 5 = 26
The range gives you an immediate sense of how spread out your data is. A small range means the values cluster closely together; a large range indicates high variability.
However, the range is also sensitive to outliers — a single extreme value dramatically increases the range without reflecting the spread of the majority of data points. This is why the range is typically used alongside other measures of spread, such as standard deviation or interquartile range, in more advanced analyses.
The Mean, Median, Mode, Range Calculator computes the range automatically and also returns the specific largest and smallest values in your dataset, giving you full context around the spread.
Geometric Mean — An Extra Statistical Insight
Beyond the four core measures, the Mean, Median, Mode, Range Calculator also computes the geometric mean — a specialized average used when dealing with values that are multiplicative in nature, such as growth rates, financial returns, or ratios.
Formula:
Geometric Mean = nth root of (x₁ × x₂ × x₃ × … × xₙ)
Example: Dataset: 2, 8, 32 Geometric Mean = ∛(2 × 8 × 32) = ∛512 = 8
The geometric mean is lower than or equal to the arithmetic mean and is the appropriate average for datasets where values multiply together over time — such as annual investment returns or compound population growth rates.
How to Use the Mean, Median, Mode, Range Calculator Step by Step
Using the Mean, Median, Mode, Range Calculator is simple and requires no statistical knowledge. Here is how:
Step 1 — Enter Your Numbers Type your dataset into the input field, separating each number with a comma. For example: 10, 2, 38, 23, 15, 7. Decimals and negative numbers are fully supported.
Step 2 — Click Calculate Press the “Calculate” button. The Mean, Median, Mode, Range Calculator will instantly sort your data and compute all statistical measures.
Step 3 — Review the Results Table The results panel displays a complete table including count, sum, mean, median, mode, range, geometric mean, largest value, and smallest value.
Step 4 — Interpret the Results Compare the mean and median to check for skewness. Look at the mode to identify the most common value. Examine the range to understand data variability.
Step 5 — Clear and Repeat Use the “Clear” button to reset the calculator for a new dataset.
Understanding the Full Output of the Calculator
The Mean, Median, Mode, Range Calculator returns nine statistical values from a single input. Here is what each one tells you:
| Output | What It Tells You |
|---|---|
| Count | How many numbers are in your dataset |
| Sum | The total of all values added together |
| Mean | The arithmetic average — the center of the data by balance |
| Median | The middle value — the center by position |
| Mode | The most common value(s) |
| Range | The total spread from smallest to largest |
| Geometric Mean | The multiplicative average — useful for growth rates |
| Largest | The maximum value in the dataset |
| Smallest | The minimum value in the dataset |
Together, these nine outputs give you a complete descriptive statistical profile of any dataset in seconds.
When to Use Mean vs. Median vs. Mode
Choosing the right measure of central tendency is essential for accurate and meaningful data interpretation. Here is a practical guide:
Use the Mean when:
- Your data is roughly symmetric (no extreme outliers)
- You need to perform further mathematical operations (the mean is mathematically tractable)
- All values are quantitative and comparable
Use the Median when:
- Your data is skewed or contains outliers
- You are dealing with income, housing prices, or other distributions where extreme values are common
- You want a robust measure of the “typical” value unaffected by extremes
Use the Mode when:
- Your data is categorical (e.g., preferred color, most popular product)
- You want to identify the most frequently occurring value in a distribution
- Your dataset is bimodal or multimodal and you want to highlight multiple peaks
The Mean, Median, Mode, Range Calculator provides all three simultaneously, empowering you to choose the most appropriate measure for your specific context — or report all three for a comprehensive view.
Mean, Median, Mode, Range Calculator in Education
The Mean, Median, Mode, Range Calculator is one of the most commonly used tools in mathematics education at every level — from primary school to university statistics courses.
In the classroom, teachers use it to:
- Teach descriptive statistics concepts with real datasets
- Verify student calculations instantly during lessons
- Demonstrate the effect of outliers on mean vs. median by adding or removing extreme values
Students use the Mean, Median, Mode, Range Calculator to:
- Complete statistics homework quickly and accurately
- Verify manual calculations before submitting assignments
- Explore how different datasets produce different statistical profiles
Standardized tests including the SAT, ACT, and GRE regularly include questions about mean, median, mode, and range. Students who thoroughly understand these concepts — and who practice with tools like the Mean, Median, Mode, Range Calculator — gain a significant advantage on these assessments.
Mean, Median, Mode, Range Calculator in Business and Finance
Businesses generate enormous volumes of numerical data every day, and descriptive statistics are the first step in making sense of it all. The Mean, Median, Mode, Range Calculator is a practical tool for business analysts, managers, and financial professionals.
Common business applications include:
- Sales Analysis — Computing mean and median daily sales to understand typical revenue performance
- Customer Research — Using the mode to identify the most commonly purchased product, most frequently selected service tier, or most popular price point
- Employee Performance — Comparing mean performance scores across departments using the Mean, Median, Mode, Range Calculator to identify top and underperforming teams
- Inventory Management — Analyzing the range of order quantities to optimize stock levels
- Financial Reporting — Summarizing quarterly revenue, expenses, or profit figures with mean, median, and range for executive dashboards
In finance, the geometric mean is especially important for calculating average annual returns on investments over multiple periods — a calculation the Mean, Median, Mode, Range Calculator performs automatically.
Mean, Median, Mode, Range Calculator in Science and Research
Scientific research depends on accurate descriptive statistics. Before running any inferential test — such as a t-test, ANOVA, or correlation analysis — researchers first describe their data using mean, median, mode, and range.
In experimental science, the Mean, Median, Mode, Range Calculator is used to:
- Summarize experimental results from repeated trials
- Identify measurement errors — an unusually large range or a mean far from the median may signal a measurement outlier
- Report data in publications — scientific papers always include descriptive statistics before presenting analytical results
In social science research, survey data is routinely analyzed using the Mean, Median, Mode, Range Calculator to summarize responses, identify common answers (mode), and assess the typical respondent’s position (mean or median).
Mean, Median, Mode, Range Calculator in Healthcare
Healthcare professionals, clinical researchers, and public health analysts regularly use descriptive statistics to interpret patient data, clinical trial results, and population health metrics.
Examples of healthcare applications:
- Patient Vital Signs — Computing mean blood pressure, median heart rate, or modal temperature reading across a patient population
- Drug Trial Results — Using the Mean, Median, Mode, Range Calculator to summarize response times, dosage levels, or symptom scores in clinical studies
- Epidemiology — Reporting mean age of disease onset, median survival time, or mode of symptom severity in public health reports
- Hospital Operations — Analyzing the range and mean of patient wait times, length of stay, or bed occupancy rates
The median is particularly important in healthcare for survival analysis and quality-of-life measures, where skewed distributions (e.g., a small number of patients with very long survival times) make the mean misleading.
O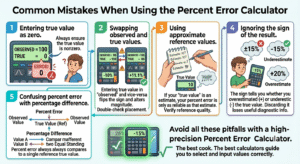
Common Mistakes When Interpreting Descriptive Statistics
Even with an accurate tool like the Mean, Median, Mode, Range Calculator, misinterpretation of results is common. Here are the most frequent mistakes to avoid:
- Using the mean in the presence of outliers — When your dataset contains extreme values, the median is a more representative measure of the center
- Ignoring the mode in categorical data — For non-numeric categories, the mode is the only valid measure of central tendency; mean and median are meaningless
- Confusing range with standard deviation — Range only captures the total spread between extremes; it says nothing about how the middle of the data is distributed
- Assuming a single “best” measure — No single measure tells the whole story. Always report mean, median, and range together for a complete picture
- Treating “no mode” as an error — When all values in a dataset are unique, there is no mode. This is a valid statistical outcome, not a calculation error
- Forgetting to consider sample size — A mean of 50 from 5 data points is far less reliable than a mean of 50 from 500 data points; context matters
Frequently Asked Questions (FAQs)
What does the Mean, Median, Mode, Range Calculator do? The Mean, Median, Mode, Range Calculator takes a list of numbers separated by commas and instantly computes nine descriptive statistics: count, sum, mean, median, mode, range, geometric mean, largest value, and smallest value.
How do I enter data into the Mean, Median, Mode, Range Calculator? Simply type your numbers into the input field separated by commas — for example: 15, 22, 8, 31, 10. Click Calculate and the results appear immediately.
Can the Mean, Median, Mode, Range Calculator handle decimal numbers? Yes. The calculator fully supports decimals and negative numbers, handling any real number input accurately.
What does it mean when the mode is “None”? “None” appears when every number in the dataset occurs exactly once — meaning no value appears more frequently than any other. This is a valid result, not an error.
Can a dataset have more than one mode? Yes. Datasets with two equally common values are bimodal; those with three or more are multimodal. The calculator identifies and displays all modes.
Why might the mean and median be very different? A large gap between mean and median usually indicates a skewed distribution — one where extreme values (outliers) pull the mean in one direction while the median remains centered on the bulk of the data.
What is the difference between range and standard deviation? Range measures only the distance between the largest and smallest values. Standard deviation measures the average spread of all values around the mean. Range is simpler; standard deviation is more informative about the distribution’s spread.
Is the Mean, Median, Mode, Range Calculator free to use? Yes. The tool is available online at no cost and requires no software installation or account registration.
How large can the dataset be? The Mean, Median, Mode, Range Calculator can handle datasets of any practical size. Simply enter as many comma-separated values as you need.
Can I use the calculator for grouped data? The current calculator is designed for raw (ungrouped) data. For grouped data, you would need to weight values by their frequencies before entering them.
Conclusion
Descriptive statistics are the foundation of all data analysis, and the four measures at the heart of this discipline — mean, median, mode, and range — provide an indispensable window into the structure of any dataset. Whether you are a student completing a statistics assignment, a teacher explaining central tendency to a class, a researcher summarizing experimental data, a business analyst interpreting sales figures, or a healthcare professional evaluating patient outcomes, the ability to quickly and accurately compute these four measures is a skill that serves you in virtually every data-driven context.
The Mean, Median, Mode, Range Calculator brings all four calculations — plus geometric mean, count, sum, and the largest and smallest values — together into a single, effortless tool. It eliminates manual arithmetic errors, saves time, and delivers a comprehensive statistical profile of your data in seconds. More importantly, by providing all measures together, it empowers you to compare them, identify patterns, spot outliers, and choose the most appropriate measure for your specific situation.
We encourage you to use the Mean, Median, Mode, Range Calculator as a regular part of your analytical workflow — whether for academic study, professional analysis, or personal curiosity. Numbers tell stories, and descriptive statistics are the grammar of that storytelling. With the right tools and a solid understanding of what mean, median, mode, and range actually represent, you are fully equipped to read, interpret, and communicate those stories with precision and confidence.