Discover Your Home Buying Budget with the Mortgage Calculator UK
Table of Contents
- Introduction
- What Is an Amortization Table Calculator?
- What Is a Mortgage Amortization Calculator?
- How Mortgage Amortization Works
- Key Inputs in an Amortization Table Calculator
- Understanding the Fixed Rate vs. SVR Rate Structure
- Extra Payments – How Overpaying Accelerates Your Payoff
- Tax Rate and Inflation in Your Amortization Analysis
- Reading Your Amortization Table – Column by Column
- The Balance Bar Chart – Visualising Your Loan Decline
- The Summary Results Panel Explained
- Why Your Early Payments Are Mostly Interest
- Strategies to Reduce Total Interest Using an Amortization Table Calculator
- How to Use Our Amortization Table Calculator Step-by-Step
- Common Amortization Mistakes Borrowers Make
- Frequently Asked Questions (FAQs)
- Conclusion
Introduction
Most homeowners make their mortgage payment every month without truly understanding where their money goes. The statement shows a payment amount, a new balance, and perhaps an interest figure — but the full story of how each payment is split, how much of your hard-earned money is building equity versus paying the lender’s profit, and exactly when your balance reaches zero, remains invisible.
An Amortization Table Calculator makes all of that visible. It processes your loan details — property value, loan amount, deposit, term, fixed rate, Standard Variable Rate, monthly payment, extra contributions, tax, and inflation — and produces a complete year-by-year breakdown of every payment’s split between interest and principal, together with a running balance that shows your progress from your first payment to your last.
In this comprehensive guide, you will learn everything about mortgage amortization — how it works, what drives it, how to interpret every column of the amortization table, and how to use the insights from an Amortization Table Calculator to pay less interest, build equity faster, and make better-informed decisions about your most significant financial commitment. Whether you are buying your first home, remortgaging, or simply reviewing your current loan’s progress, this guide and our free Amortization Table Calculator give you the complete picture.
What Is an Amortization Table Calculator?
An Amortization Table Calculator is a financial tool that generates a complete schedule of loan repayments — showing, for each period (typically each year), the total payment made, the portion allocated to interest, the portion reducing principal, and the remaining loan balance. It transforms the abstract concept of a mortgage into a concrete, trackable financial plan.
The word “amortization” comes from the Latin “amortire” — to kill off or extinguish. In mortgage terms, it refers to the gradual extinguishing of a debt through regular scheduled payments. An Amortization Table Calculator maps this extinguishing process year by year, making it possible to see at a glance how many years remain until the debt is fully paid, how much interest has accumulated to date, and what balance remains at any given point.
What distinguishes our Amortization Table Calculator from basic online payment calculators is its comprehensive input structure — twelve fields capturing property value, loan amount, deposit, full term, fixed period, product fee, fixed interest rate, SVR rate, monthly payment, extra payment, tax rate, and inflation. Together, these inputs produce a multi-layered amortization analysis that reflects the genuine complexity of modern mortgage structures rather than simplified single-rate projections.
The output includes a visual bar chart of your annual balance decline, a complete year-by-year amortization table, and a detailed result summary — making the Amortization Table Calculator a complete mortgage management dashboard.
What Is a Mortgage Amortization Calculator?
A Mortgage Amortization Calculator is a specific application of the amortization table concept to residential and investment property loans. It calculates how a mortgage — typically the largest debt obligation most people carry — is repaid over its full term through a series of regular payments that cover both interest costs and principal reduction.
The core function of a Mortgage Amortization Calculator is to answer four fundamental questions:
How much of each payment goes to interest? In the early years of a mortgage, the overwhelming majority of each payment covers interest rather than reducing the principal. A Mortgage Amortization Calculator makes this split explicit for every year of the loan.
How much of each payment reduces my debt? The principal-reducing portion of each payment — often called the equity-building portion — grows over time as the balance decreases and interest charges fall.
What will my balance be at any given point? Planning a remortgage, a sale, or an overpayment strategy requires knowing your projected balance at specific future dates. The Amortization Table Calculator provides this data instantly for every year of the term.
How much total interest will I pay? The sum of all interest column entries in the amortization table reveals the true lifetime cost of the mortgage — a figure that often shocks borrowers who have only considered the monthly payment.
Our Amortization Table Calculator implements all of these functions with the added sophistication of a two-phase rate model (fixed period plus SVR), extra payment modelling, tax impact, and inflation adjustment.
How Mortgage Amortization Works
Understanding the mathematics behind mortgage amortization is essential for getting the most from an Amortization Table Calculator. The process follows a straightforward but powerful mechanism:
The Standard Amortization Formula:
Each monthly payment is calculated to precisely cover the interest accrued on the outstanding balance plus a portion of principal that increases the payment will extinguish the balance to zero by the final payment of the term.
Interest Calculation: Monthly interest = Outstanding Balance × (Annual Rate ÷ 12)
Principal Reduction: Principal paid = Monthly Payment − Monthly Interest
New Balance: Previous Balance − Principal Paid
The crucial insight is that as your balance decreases, the interest charge on each payment decreases too — meaning an increasing proportion of each fixed payment goes toward principal. This is the accelerating equity effect that the Amortization Table Calculator makes visible in its year-by-year table.
For a $250,000 mortgage at 3.5% over 15 years, the monthly payment is approximately $1,787. In year 1, roughly $8,700 of total annual payments covers interest and $12,750 reduces principal. By year 10, the interest portion has fallen to approximately $4,500 while principal reduction has risen to $17,000 per year — the same monthly payment doing dramatically more equity-building work as the balance decreases.
Key Inputs in an Amortization Table Calculator
Twelve carefully chosen input fields make our Amortization Table Calculator one of the most comprehensive available. Here is what each field captures and why it matters:
Property Value ($): The current or purchase market value of the property. This establishes your Loan-to-Value ratio and serves as the benchmark against which equity is measured.
Loan Amount ($): The principal balance you are borrowing — or, for existing mortgages, the current outstanding balance you are managing. This is the most important single input in the Amortization Table Calculator, as it directly determines every interest calculation in the table.
Deposit ($): The cash you are contributing toward the purchase. In the amortization context, the deposit is the equity you hold from day one — the starting gap between property value and loan balance.
Term (Years): The full repayment period of your mortgage. The term determines how many rows appear in the amortization table and profoundly influences both the monthly payment amount and the total interest paid. Longer terms lower monthly payments but produce dramatically more total interest — a trade-off the Amortization Table Calculator makes immediately quantifiable.
Fixed Term (Years): The number of years at the initial fixed rate. After this period, the rate transitions to the SVR. Entering this accurately ensures the amortization table reflects the true two-phase rate structure of your mortgage.
Product Fee ($): The arrangement or product fee associated with the mortgage deal. This can be added to the loan or paid upfront. Including it in the Amortization Table Calculator ensures your total cost analysis captures this often-overlooked expense.
Fixed Rate (%): Your initial fixed interest rate — the attractive introductory rate that applies during the fixed term. This rate drives the interest calculations for every year within the fixed period in the amortization table.
SVR Rate (%): The Standard Variable Rate that applies after the fixed period expires. SVRs are typically significantly higher than the initial fixed rate, and the transition to SVR often produces a visible change in the interest-to-principal split in the amortization table.
Monthly Payment ($): Your contracted monthly mortgage payment. This is the consistent cash outflow that the amortization schedule is built around.
Extra Payment ($): Any voluntary monthly overpayment above the contracted amount. Extra payments go directly to principal reduction, shortening the term and reducing total interest — and the Amortization Table Calculator shows exactly how this acceleration plays out year by year.
Tax Rate (%): Applicable for buy-to-let investors and landlords calculating net returns. For owner-occupiers, this field provides context for the investment’s overall financial efficiency.
Inflation (%): The expected annual inflation rate — used to calculate the inflation-adjusted real value of the loan balance and payments over time.
Understanding the Fixed Rate vs. SVR Rate Structure
One of the most powerful features of our Amortization Table Calculator is its two-rate model that reflects the real structure of most mortgage products — an initial fixed period followed by reversion to the Standard Variable Rate.
During the Fixed Period: Your interest rate is locked and the amortization table shows consistent, predictable interest charges year over year. This is typically the most favourable phase of the mortgage — lower rates mean a higher proportion of each payment goes toward principal reduction.
At the SVR Transition: When your fixed period expires and the rate steps up to the SVR, two things happen. First, the monthly payment may increase if the SVR-driven payment exceeds your previous fixed-rate payment. Second, and more visibly in the amortization table, the annual interest charge increases noticeably — meaning a larger proportion of each payment covers interest and a smaller proportion reduces your balance.
The amortization table clearly shows this transition: you will see a jump in the annual interest column at the year when the SVR kicks in, followed by a flatter decline in the balance column compared to the steeper decline during the fixed period.
This visual shift in the Amortization Table Calculator is one of the most compelling arguments for remortgaging before reverting to the SVR. By securing a new competitive rate at the end of your fixed term, you can maintain the favourable amortization trajectory of the fixed period rather than allowing the SVR to slow your equity building.
Extra Payments – How Overpaying Accelerates Your Payoff
The Extra Payment field in our Amortization Table Calculator is one of the most practically valuable tools for any mortgage holder who wants to reduce their total interest cost and pay off their loan ahead of schedule.
When you make extra payments above the contracted monthly amount, 100% of the overpayment reduces your principal balance. This has a compounding effect: a lower balance means lower interest in the next period, which means more of the standard payment reduces principal, which lowers the balance further — a virtuous cycle that accelerates payoff exponentially.
The Amortization Table Calculator quantifies this effect year by year. Compare your amortization table with zero extra payments against one with $100 or $200 per month in overpayments — the balance column diverges increasingly over time, and the point at which the balance reaches zero arrives noticeably earlier.
Practical overpayment strategies:
- Regular monthly overpayment: The most consistent approach — set a fixed extra amount each month and let the compounding work over time.
- Annual lump sum: Apply any bonus, tax refund, or windfall income directly to the mortgage principal. The Amortization Table Calculator shows what this does to your future balance trajectory.
- Round-up payments: Simply rounding your monthly payment up to the nearest $50 or $100 produces meaningful long-term savings with minimal monthly impact.
Before making overpayments, verify your lender’s Early Repayment Charge (ERC) policy. Most lenders allow a percentage overpayment (typically 10% of the outstanding balance per year) without penalty. Exceeding this limit can trigger charges that offset the interest savings.
Tax Rate and Inflation in Your Amortization Analysis
Two inputs in our Amortization Table Calculator go beyond the standard mortgage payment model to incorporate broader financial context — tax rate and inflation:
Tax Rate: For buy-to-let investors, the tax rate directly affects the net return on rental income and the true cost of mortgage interest. Since UK mortgage interest relief changes (2017 onward), landlords receive only a 20% basic rate tax credit on mortgage interest rather than full deduction — making after-tax cashflow analysis essential. The Amortization Table Calculator’s tax rate field allows investors to model the true after-tax cost of their mortgage alongside the standard amortization data.
For owner-occupiers, the tax rate field provides a comparative context — understanding what the mortgage costs relative to your income tax position helps evaluate whether accelerated paydown or alternative investment makes more financial sense.
Inflation: Over a 15 or 30-year mortgage term, inflation significantly affects the real value of your remaining debt. A $250,000 balance today is equivalent to a much smaller amount in real purchasing power terms in 20 years. The Amortization Table Calculator’s inflation input allows you to model the real, inflation-adjusted trajectory of your loan balance — providing a more complete picture of your debt burden over time.
The inflation-adjusted perspective often makes long-term mortgages look more manageable than their nominal balance suggests — though it should never be used to justify avoiding overpayment strategies that genuinely reduce total interest cost.
Reading Your Amortization Table – Column by Column
The amortization table is the centrepiece of any Amortization Table Calculator, and knowing how to read it correctly transforms it from a number grid into a powerful financial planning instrument.
Year: Each row represents one complete year of the mortgage term. For a 15-year mortgage, the table has 15 rows — from the first payment year through to payoff.
Payment: The total annual payment — your monthly payment multiplied by 12, plus any extra annual overpayment. This column remains constant (assuming a fixed payment structure) until the rate changes at the SVR transition, at which point it reflects the new higher SVR-driven payment amount.
Interest: The total interest charged on your outstanding balance during that year. This column starts high and declines gradually as your balance falls. Early years show a large interest figure relative to the payment; later years show a dramatically smaller interest figure as the balance shrinks.
Balance: Your outstanding principal at the end of each year. This column is the core equity-tracking figure in the Amortization Table Calculator. Early years show modest balance reductions; later years — when interest charges are lower and principal reduction is higher — show increasingly large annual drops in balance.
How to use the table for planning:
- Remortgage timing: Find the row corresponding to your fixed term end date to see your projected balance — the basis for your next mortgage application.
- Sale planning: If you plan to sell in a specific year, the balance column tells you exactly what you will owe at that point and therefore how much equity you will release.
- Overpayment modelling: Compare two versions of your table — with and without extra payments — to quantify the benefit of overpaying.
- Long-term wealth building: Observe the accelerating equity growth in the later rows — a visual reminder of why staying the course matters.
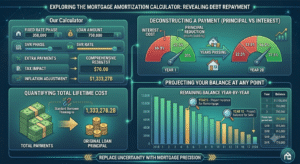
The Balance Bar Chart – Visualising Your Loan Decline
Our Amortization Table Calculator generates a bar chart that plots your outstanding balance for each year of the mortgage term — providing an intuitive visual complement to the numerical amortization table.
The bar chart immediately communicates the amortization curve: tall bars in the early years give way to progressively shorter bars as the balance declines, with the final bar approaching zero to confirm full repayment by term end.
Key features of the balance chart:
Early year flatness: The first several bars are nearly equal in height — reflecting the slow initial balance reduction when most of each payment covers interest. This visual flatness is one of the most motivating reasons to make extra payments — it shows clearly how little equity is being built in the early years at standard payment levels.
Mid-term inflection: Around the midpoint of the term, the bars begin declining noticeably faster as the principal-reducing power of each payment accelerates.
Final year approach: The last bar drops steeply toward zero, confirming the mathematical precision of the amortization schedule in extinguishing the debt exactly at term end.
Use the balance chart alongside the table in the Amortization Table Calculator to identify the most equity-rich years for any financial decision — sale, refinance, equity release, or additional borrowing.
The Summary Results Panel Explained
Alongside the amortization table, our Amortization Table Calculator displays a twelve-point summary panel that confirms every input value with appropriate currency and percentage formatting.
This summary panel serves several purposes:
Verification: It confirms that all twelve inputs have been correctly entered and processed — important when modelling multiple scenarios sequentially.
Quick Reference: Having all key loan parameters in one view makes it easy to compare the summary against your actual mortgage documents and identify any discrepancies in your planning assumptions.
Stakeholder Communication: When presenting mortgage analysis to a partner, financial adviser, or accountant, the clean summary panel provides an immediate at-a-glance overview of the loan structure being analysed.
The summary displays: Property Value, Loan Amount, Deposit, Term, Fixed Term, Product Fee, Fixed Rate, SVR Rate, Monthly Payment, Extra Payment, Tax Rate, and Inflation — the complete parameterisation of the amortization model.
Why Your Early Payments Are Mostly Interest
The front-loading of interest in early mortgage payments is one of the most important — and least understood — facts about mortgage amortization. Our Amortization Table Calculator makes this reality starkly visible in the Year 1 row of the table.
Consider a $250,000 mortgage at 3.5% over 15 years with a monthly payment of $1,787:
- Year 1 total payment: approximately $21,444
- Year 1 interest cost: approximately $8,700
- Year 1 principal reduction: approximately $12,750
Over 40% of the first year’s payments go to interest, not equity. In year 15, the split is reversed — over 90% of each payment reduces principal.
This front-loading exists because interest is always calculated on the outstanding balance, which is largest in the early years. As the balance falls, so does the interest charged — mathematically inevitable, but invisible without an Amortization Table Calculator to make it explicit.
Why this matters for your financial planning:
- Refinancing early: If you refinance in the first 5 years, you have paid significant interest but built relatively little equity — the new loan resets this cycle.
- Extra payment timing: Extra payments in the early years, when the balance is highest, produce the greatest interest savings because they reduce the base against which interest is calculated for all subsequent years.
- Realistic equity expectations: Buyers who expect to have paid off a meaningful portion of principal in the first 5 years are often surprised. The Amortization Table Calculator sets realistic expectations from the start.
Strategies to Reduce Total Interest Using an Amortization Table Calculator
The Amortization Table Calculator is not just a reporting tool — it is an active planning instrument. Here are the most effective strategies for reducing total mortgage interest, each of which can be modelled in the calculator:
Make Regular Extra Payments: Even $100 per month in overpayments on a $250,000 mortgage at 3.5% over 15 years saves thousands in total interest and shortens the term by months or years. Run both scenarios in the Amortization Table Calculator to see the exact saving.
Choose a Shorter Term When Possible: A 15-year mortgage versus a 30-year mortgage on the same loan amount and rate produces dramatically less total interest — often saving more than the original loan amount. Model both terms in the Amortization Table Calculator to see the payment increase required versus the interest saving achieved.
Remortgage at the End of Every Fixed Period: As shown by the rate transition in the amortization table, reverting to the SVR is expensive. Securing a new competitive rate every 2 to 5 years maintains favourable amortization momentum.
Make Lump Sum Payments Against Principal: Apply any windfall income — bonuses, inheritances, tax refunds — directly to the mortgage balance. Enter different extra payment amounts into the Amortization Table Calculator to find the most impactful deployment of available cash.
Avoid Extending Your Term: When facing payment pressure, some borrowers extend their mortgage term to lower monthly payments. While this provides relief, it dramatically increases total interest and delays full ownership. The Amortization Table Calculator shows the precise total interest cost of any term extension decision.
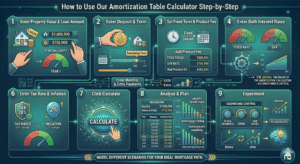
How to Use Our Amortization Table Calculator Step-by-Step
Our free Amortization Table Calculator is intuitive, comprehensive, and produces instant results. Here is the complete step-by-step guide:
Step One – Enter Property Value and Loan Amount: Input your property’s current value and your outstanding or planned loan amount. These two figures establish your starting equity position.
Step Two – Enter Deposit and Term: Input your deposit amount and the full mortgage term in years. For existing mortgages, enter the remaining term.
Step Three – Set Fixed Term and Product Fee: Enter the number of years at your fixed rate and the product arrangement fee. These ensure the two-phase rate model and fee impact are captured accurately.
Step Four – Enter Both Interest Rates: Input your fixed rate and your lender’s current SVR. These two rates are the engine of the amortization calculation — accuracy here is critical for a realistic table.
Step Five – Enter Monthly and Extra Payments: Input your contracted monthly payment and any planned monthly overpayment.
Step Six – Enter Tax Rate and Inflation: Input your applicable tax rate and an inflation estimate. Standard inputs are 20% tax and 2% to 3% inflation.
Step Seven – Click Calculate: Instantly view your complete result summary, the year-by-year amortization table, and the balance bar chart.
Step Eight – Analyse and Plan: Use the table to identify your break-even equity point, plan your remortgage timing, model overpayment strategies, and understand the true total cost of your mortgage.
Step Nine – Experiment: Change input values — different extra payment amounts, different terms, different rates — and recalculate to model different scenarios. The Amortization Table Calculator is most powerful when used iteratively.
Common Amortization Mistakes Borrowers Make
Even financially literate borrowers make errors in mortgage amortization planning. Here are the most frequent — all preventable with proper use of an Amortization Table Calculator:
Assuming Equal Principal Reduction Each Year: Many borrowers believe each payment reduces the balance by the same amount. In reality, principal reduction accelerates over time. The Amortization Table Calculator shows the actual trajectory, which is very different from equal annual reduction.
Ignoring the SVR Transition: Failing to account for the rate jump at the end of the fixed period leads to shock at higher payments and a slower balance decline. Always model both the fixed and SVR phases in the Amortization Table Calculator.
Overlooking Product Fees in Total Cost: A low-rate mortgage with a high product fee can cost more than a slightly higher-rate mortgage with no fee. Enter both scenarios into the Amortization Table Calculator to compare true total cost.
Not Modelling Extra Payments: Many borrowers who could afford modest overpayments simply do not because they have not seen the quantified benefit. The Amortization Table Calculator makes the benefit concrete and compelling.
Planning a Sale Without Checking the Balance: Assuming a property sale will yield a certain profit without verifying the actual outstanding balance leads to planning errors. Always check the relevant year’s balance column in the Amortization Table Calculator before making sale plans.
Frequently Asked Questions (FAQs)
What is an Amortization Table Calculator? An Amortization Table Calculator is a financial tool that generates a year-by-year schedule of mortgage repayments, showing the annual payment, interest charge, principal reduction, and outstanding balance for every year of the loan term. It provides complete visibility into how a mortgage is repaid over time.
What is a Mortgage Amortization Calculator? A Mortgage Amortization Calculator is an Amortization Table Calculator applied specifically to home loan scenarios, incorporating mortgage-specific features like fixed/SVR rate structures, product fees, deposit amounts, and overpayment modelling.
Is the Amortization Table Calculator free? Yes. Our Amortization Table Calculator is completely free with no registration required. Enter your mortgage details and receive instant comprehensive results including summary, table, and chart.
Why does so much of my early payment go to interest? Because interest is calculated on the outstanding balance, which is largest at the start of the mortgage. As you pay down the balance, interest charges fall and more of each payment reduces principal. The Amortization Table Calculator shows this shift year by year.
How does the fixed rate to SVR transition appear in the amortization table? At the year your fixed period ends, you will see a change in the interest column — typically an increase — as the higher SVR rate is applied to the outstanding balance. This transition is clearly visible in the Amortization Table Calculator’s year-by-year table.
How do extra payments affect the amortization table? Extra payments reduce the principal balance faster, which reduces future interest charges and accelerates the payoff timeline. Enter different extra payment amounts in the Amortization Table Calculator to see how overpaying changes your balance trajectory.
What is the product fee and how does it affect the amortization analysis? The product fee is an arrangement charge for your mortgage deal. It can be added to the loan (increasing the balance on which interest accrues) or paid upfront. The Amortization Table Calculator captures this fee in the result summary so you can account for it in your total cost analysis.
Can I use the Amortization Table Calculator to plan a property sale? Yes. Find the year in which you plan to sell in the table’s balance column — this shows your projected outstanding balance at that point, allowing you to calculate your expected equity at sale.
How accurate is the Amortization Table Calculator? Highly accurate for the inputs provided. Results reflect standard amortization mathematics with adjustments for your specific rate structure and extra payments. For binding financial decisions, always verify results with your lender or a qualified mortgage adviser.
What should I do when my fixed period ends? Begin shopping for a new fixed-rate deal approximately 3 to 6 months before your fixed period ends. Use the Amortization Table Calculator to project your balance at that date and ensure you remortgage based on your actual outstanding debt.
Conclusion
Your mortgage is not just a monthly payment — it is a decades-long financial relationship with profound implications for your wealth, your equity, and your financial freedom. Understanding exactly how that relationship works, year by year, payment by payment, is not just helpful — it is essential for making the smart decisions that separate confident, informed homeowners from those who simply follow the default path their lender set.
Our free Amortization Table Calculator gives you that understanding. By entering your twelve mortgage parameters — property value, loan amount, deposit, term, fixed period, product fee, both interest rates, monthly payment, extra contributions, tax rate, and inflation — you receive a complete financial picture: a twelve-point result summary, a year-by-year amortization table showing every annual payment split between interest and principal, and a balance bar chart that visualises your loan’s decline from first payment to final payoff.
Whether you are evaluating a new mortgage, planning your remortgage timing, deciding whether to overpay, modelling the impact of selling in a specific year, or simply trying to understand where your money actually goes each month, the Amortization Table Calculator is your essential companion. It turns complexity into clarity, turns abstract repayment schedules into concrete year-by-year roadmaps, and turns passive borrowers into empowered financial decision-makers.
Use our Amortization Table Calculator today. Know your numbers. Plan your strategy. Own your financial future.