See How Much You Need Upfront Down Payment Calculator
Table of Contents
- Introduction
- What Is the Break Even Period Formula?
- What Is a Payback Period Calculator?
- Why the Break Even Period Formula Matters for Every Business Decision
- The Two Core Calculator Scenarios Explained
- Business Expansion ROI – When Should You Grow?
- Equipment Purchase Payback – Is the Asset Worth Buying?
- Key Inputs in the Payback Period Calculator
- Understanding the Seven Result Metrics
- How Tax and Maintenance Affect Net Cash Flow
- The Year-by-Year Payback Table Explained
- Simple vs. Discounted Break Even Period Formula
- What Is a Good Payback Period?
- How to Use Our Payback Period Calculator Step-by-Step
- Limitations of the Break Even Period Formula
- Frequently Asked Questions (FAQs)
- Conclusion
Introduction
Every business investment carries a fundamental question that must be answered before a single dollar is committed: how long will it take to get my money back? Whether you are planning a business expansion, purchasing new equipment, launching a product line, or acquiring an asset, understanding when your investment will recover its cost and begin generating true profit is the bedrock of sound financial decision-making.
The Break Even Period Formula is the mathematical tool that answers this question. It calculates the precise number of years required for cumulative net cash inflows to equal the initial investment — the moment at which the financial scales tip from loss to gain, from expenditure to return. Beyond that point, every dollar of net cash flow is pure profit.
In this comprehensive guide, you will learn exactly what the Break Even Period Formula is, how it works across two critical business scenarios — Business Expansion ROI and Equipment Purchase Payback — what inputs drive the calculation, how to interpret every result, and when the payback period approach is the right tool for your financial analysis. Our free Payback Period Calculator implements the Break Even Period Formula automatically, so you can evaluate any investment in seconds with complete financial clarity.
What Is the Break Even Period Formula?
The Break Even Period Formula is a financial calculation that determines the number of periods (typically years) required for the cumulative net cash inflows from an investment to recover its total initial cost. It is one of the most widely used capital budgeting tools in both corporate finance and personal business decision-making.
The standard Break Even Period Formula is:
Payback Period = Initial Investment ÷ Annual Net Cash Flow
For example, if you invest $50,000 in a business expansion that generates $12,000 in annual net cash flow after taxes and maintenance, the Break Even Period Formula gives:
$50,000 ÷ $12,000 = 4.17 years
This means you will recover your full investment in approximately 4 years and 2 months. Every dollar generated after that point is profit above and beyond your original capital.
When cash flows are uneven across years — as in the Equipment Purchase Payback scenario where inflows grow each year due to an efficiency or growth factor — the Break Even Period Formula requires a cumulative approach: adding each year’s net cash flow to a running total until the balance equals or exceeds the initial investment. Our Payback Period Calculator handles both constant and variable cash flow scenarios automatically, applying the correct version of the Break Even Period Formula to your inputs.
What Is a Payback Period Calculator?
A Payback Period Calculator is an online financial tool that automates the Break Even Period Formula across multiple investment scenarios, handling all the tax adjustments, cost deductions, growth projections, and risk factors that make manual calculation complex and error-prone.
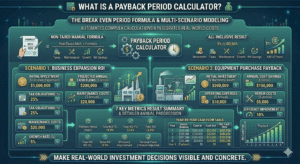
Our free Payback Period Calculator covers two distinct investment scenarios:
Business Expansion ROI: Evaluates whether a planned business expansion — new location, new product line, increased capacity — will recover its investment within an acceptable timeframe given projected annual cash flows, tax obligations, maintenance costs, and growth rates.
Equipment Purchase Payback: Determines whether the purchase of a significant piece of equipment or machinery is financially justified based on annual cost savings, repair costs, operating expenses, and efficiency improvements over the asset’s useful life.
For each scenario, the Payback Period Calculator applies the Break Even Period Formula to your specific inputs and produces a seven-metric result summary plus a year-by-year cash flow table showing exactly how your investment balance decreases to zero and beyond — giving you both the headline payback figure and the detailed annual progression.
A well-designed Payback Period Calculator does more than compute a single number. It incorporates real-world cost factors — tax rates, maintenance expenses, growth percentages, and efficiency improvements — that affect the true net cash flow and therefore the accuracy of the Break Even Period Formula output. Our calculator captures all of these variables for each scenario.
Why the Break Even Period Formula Matters for Every Business Decision
Capital is finite, and every investment decision has an opportunity cost. Money committed to one project cannot be deployed in another. The Break Even Period Formula helps decision-makers prioritise investments by revealing which opportunities return capital fastest — enabling faster redeployment into new growth opportunities.
Here is why applying the Break Even Period Formula to every significant investment is essential:
Risk Management: Longer payback periods expose businesses to more risk. Economic conditions change, competitors emerge, regulations shift, and technology evolves. A short payback period from the Break Even Period Formula reduces the window during which an investment is exposed to these unpredictable forces.
Cash Flow Planning: Knowing when an investment will break even allows finance teams to plan cash flows, credit facilities, and operational budgets around the payback timeline. The Break Even Period Formula gives you a concrete anchor for multi-year financial planning.
Investment Comparison: When evaluating multiple potential investments with similar costs, the Break Even Period Formula quickly identifies which option returns capital fastest — providing a simple, objective ranking criterion.
Stakeholder Communication: Presenting payback period analysis to lenders, investors, or board members is straightforward and intuitive. Unlike more complex metrics like NPV or IRR, the Break Even Period Formula result is immediately understandable to anyone: “this investment pays for itself in 3.5 years.”
Capital Efficiency: Businesses that consistently apply the Break Even Period Formula to investment decisions tend to deploy capital more efficiently — favouring projects that generate returns quickly and avoiding commitments that tie up resources for extended periods without adequate cash flow.
The Two Core Calculator Scenarios Explained
Our Payback Period Calculator implements the Break Even Period Formula across two distinct real-world investment scenarios. Each is designed to reflect a different type of capital commitment with its own unique input structure:
Business Expansion ROI addresses growth-oriented investments — decisions to expand an existing business operation through increased capacity, new locations, additional staff, marketing campaigns, or new product launches. These investments typically generate incremental cash flows rather than cost savings.
Equipment Purchase Payback addresses asset-based investments — decisions to purchase machinery, vehicles, technology systems, or other capital equipment that generates value through cost savings, operational efficiency, or increased productive capacity. These investments are evaluated primarily on the basis of annual savings versus acquisition and operating costs.
Applying the Break Even Period Formula to both types of investment through a purpose-built calculator ensures that the specific cost structures of each scenario are captured accurately — rather than forcing both through an identical generic formula that may miss important variables.
Business Expansion ROI – When Should You Grow?
The Business Expansion ROI scenario in our Payback Period Calculator applies the Break Even Period Formula to growth investments — helping you determine whether and when a planned expansion will recover its cost.
Investment ($): The total upfront cost of the expansion — construction, fit-out, staffing, marketing, inventory, or any other capital required to execute the growth plan. This is the numerator in the Break Even Period Formula and must capture all one-time costs completely.
Annual Cash Flow ($): The projected additional annual revenue (or net profit) generated by the expansion. This figure should be based on realistic, conservative market projections — not aspirational best-case scenarios. Overstating annual cash flow produces an artificially short payback period that may never be achieved in practice.
Duration (Years): The number of years over which you want to model the investment’s cash flows. Setting a longer duration allows you to see not just the payback point but the total cumulative return over the full investment horizon.
Tax Rate (%): The applicable income tax rate on business profits. Tax is not optional — it is a mandatory cost that reduces your actual net cash flow and is explicitly incorporated into the Break Even Period Formula calculation in our Payback Period Calculator.
Maintenance Cost ($): Annual ongoing costs required to sustain the expanded operation — lease payments, software subscriptions, equipment servicing, or staffing costs that recur each year of the investment period.
Growth (%): The expected annual growth rate of your cash flows. A 5% growth rate means year 2 cash flow is 5% higher than year 1, year 3 is 5% higher than year 2, and so on. This input converts the static Break Even Period Formula into a dynamic model that reflects realistic business growth trajectories.
Equipment Purchase Payback – Is the Asset Worth Buying?
The Equipment Purchase Payback scenario applies the Break Even Period Formula to asset acquisition decisions — one of the most common capital budgeting challenges in manufacturing, logistics, agriculture, construction, and service industries.
Asset Cost ($): The total acquisition cost of the equipment, including purchase price, delivery, installation, and any initial configuration or training costs. This is the full capital outlay against which the Break Even Period Formula measures cumulative savings.
Annual Saving ($): The annual cost savings generated by the equipment — reduced labour costs, lower material waste, faster production throughput, or eliminated subcontracting expenses. This is the primary cash flow figure in the equipment payback calculation.
Duration (Years): The modelling horizon — typically set equal to or shorter than the asset’s expected useful life. There is no value in modelling payback beyond the point at which the asset will need replacing.
Repair Cost ($): Annual maintenance and repair expenses for the equipment. Newer equipment typically has low repair costs in early years, rising in later years. Enter a realistic annual average across the asset’s useful life.
Operating Cost ($): Recurring annual operating expenses beyond repair — power consumption, consumable supplies, operator wages (incremental), insurance, and similar costs. These expenses directly reduce net annual savings and extend the payback period in the Break Even Period Formula calculation.
Efficiency (%): The annual percentage improvement in the equipment’s productive output or cost savings — reflecting learning curve effects, operational optimisation, or incremental capacity gains. This variable growth factor is applied year by year in the amortization table, producing increasingly favourable net cash flows in later years.
Key Inputs in the Payback Period Calculator
Both scenarios in the Payback Period Calculator use six carefully chosen inputs that collectively capture every financially significant variable affecting the accuracy of the Break Even Period Formula output:
Investment / Asset Cost: The total initial capital outlay — the number the Break Even Period Formula is trying to recover. Accuracy here is paramount. Underestimating initial cost produces an optimistically short payback period.
Annual Cash Flow / Annual Saving: The primary income or savings figure. This drives the denominator of the Break Even Period Formula and has the greatest impact on the calculated payback period. A 10% improvement in annual cash flow produces a roughly 10% reduction in payback period.
Duration: Defines the time horizon of the analysis. Setting this to the expected useful life of the investment produces the most realistic assessment of total return.
Tax Rate / Repair Cost: These fields capture the cost of tax obligations and maintenance — real expenses that reduce net cash flow and lengthen the true payback period compared to a naive gross cash flow calculation.
Maintenance Cost / Operating Cost: Recurring operating expenses that must be subtracted from gross inflows to determine true net cash flow for the Break Even Period Formula.
Growth % / Efficiency %: The variable growth factors that make the cash flow projection dynamic rather than static — reflecting how real investments evolve over time as markets grow and operations optimise.
Understanding the Seven Result Metrics
Our Payback Period Calculator produces seven result points for each scenario, collectively providing a complete financial summary of the investment:
Investment / Asset Cost: Confirms the starting capital outlay — the exact figure the Break Even Period Formula is working to recover.
Gross Annual Cash / Annual Saving: The pre-tax, pre-cost cash flow figure — the gross revenue or savings before deductions.
Tax Deduction: The annual tax liability calculated from your entered tax rate. Seeing tax as an explicit line item reinforces its importance — many informal payback calculations forget tax entirely, producing dangerously optimistic results.
Maintenance Cost / Repair Cost: The annual ongoing cost subtracted from gross cash flow to arrive at net flow.
Net Annual Flow: The most important figure in the Break Even Period Formula. This is Gross Annual Cash minus Tax minus Maintenance — the actual net cash generated per year that works toward recovering the initial investment.
Payback Period: The Break Even Period Formula result — the number of years required to fully recover the initial investment from net annual cash flows. This is the headline metric: the answer to “when do I get my money back?”
Risk Adjustment / Efficiency %: The growth or risk factor entered by the user — a reminder that the projection carries inherent uncertainty proportional to this percentage.
How Tax and Maintenance Affect Net Cash Flow
One of the most valuable contributions of a proper Payback Period Calculator is its explicit treatment of tax and maintenance costs — variables that dramatically affect the accuracy of the Break Even Period Formula but are frequently omitted from informal calculations.
Tax Impact: Consider a business expansion with $12,000 annual gross cash flow and a 20% tax rate. Naive application of the Break Even Period Formula without tax gives: $50,000 ÷ $12,000 = 4.17 years. But after 20% tax ($2,400), net cash flow is only $9,600. Adding $1,000 maintenance leaves net flow of $8,600. The correct Break Even Period Formula result is $50,000 ÷ $8,600 = 5.81 years — nearly 40% longer than the naive calculation. This difference is the financial equivalent of an entire extra year and a half of waiting.
Maintenance Impact: Maintenance costs are easy to underestimate because they feel small compared to the investment size. But $1,000 per year over a 5-year project is $5,000 in total costs — 10% of a $50,000 investment. Always enter realistic maintenance estimates in the Payback Period Calculator to ensure the Break Even Period Formula reflects true net flows.
The year-by-year table explicitly shows tax and net flow for every year of the projection, making it impossible to overlook these costs and ensuring that every user of the Break Even Period Formula sees the after-tax, after-cost reality of their investment.
The Year-by-Year Payback Table Explained
The amortization table is one of the most powerful outputs of our Payback Period Calculator, transforming the single-number Break Even Period Formula result into a year-by-year financial narrative.
The table displays four columns:
Year: The sequential year of the investment period, from year 1 through the full duration entered.
Cash In: The gross annual cash inflow or saving for that year — reflecting any growth or efficiency factor applied from the base year.
Tax: The annual tax deduction calculated at your entered tax rate — applied to the gross inflow figure for that year.
Balance: The remaining unrecovered investment balance at the end of each year. This column is the clearest indicator of the Break Even Period Formula in action — a large positive number in early years that shrinks toward zero as cumulative net flows recover the investment.
Key insights from the payback table:
- The break-even year: The row in which the Balance column first reaches or crosses zero — the visual confirmation of the Break Even Period Formula result.
- Post-payback profit: All years beyond the break-even point show negative balance figures (investment fully recovered), representing cumulative profit above the initial investment.
- Growth effect: When a growth or efficiency factor is applied, cash inflows increase year over year — visible in the Cash In column — accelerating the payback in later years.
Simple vs. Discounted Break Even Period Formula
The standard Break Even Period Formula used in our calculator is the simple (undiscounted) payback method. This is the most widely used approach in practice because of its simplicity and intuitive clarity. However, it is important to understand the distinction between simple and discounted payback:
Simple Break Even Period Formula: Divides initial investment by annual net cash flow without adjusting for the time value of money. A dollar received in year 5 is treated identically to a dollar received in year 1.
Discounted Payback Period: Applies a discount rate (typically the cost of capital or required rate of return) to future cash flows before accumulating them toward the investment total. Because future cash flows are worth less in present value terms, the discounted payback period is always longer than the simple Break Even Period Formula result.
When to use each approach:
- Simple Break Even Period Formula: Appropriate for quick comparisons, short investment horizons (under 5 years), or situations where inflation and interest rates are low. Our Payback Period Calculator uses the simple approach.
- Discounted payback: More appropriate for long-horizon investments where the time value of money is significant, or when comparing investments with very different cash flow timing profiles.
For most practical business decisions — particularly the scenarios our Payback Period Calculator addresses — the simple Break Even Period Formula provides sufficient accuracy and the significant advantage of intuitive clarity.
What Is a Good Payback Period?
One of the most common questions after running the Break Even Period Formula is: “Is this result good?” The answer depends heavily on the type of investment, the industry context, and the organisation’s required rate of return.
General benchmarks by investment type:
- Small business expansion: 2 to 4 years is typically considered strong; 5 to 7 years is acceptable; beyond 7 years warrants careful scrutiny.
- Equipment purchase: 2 to 5 years for most industrial equipment; shorter for high-utilisation assets like production machinery; longer may be acceptable for long-lived infrastructure assets.
- Technology investment: 1 to 3 years is ideal given rapid obsolescence cycles; anything beyond 5 years for technology carries significant obsolescence risk.
- Real estate and infrastructure: 7 to 15 years may be acceptable given the asset durability and appreciation potential.
Context matters as much as the number. A 6-year payback period for an expansion generating 15% annual return may be excellent. A 6-year payback for a declining-market investment with significant competitive risk may be unacceptable.
The Break Even Period Formula gives you the number — your judgement, informed by market knowledge and risk assessment, gives it meaning. Use the Payback Period Calculator to generate the number, then apply your business context to evaluate it.
How to Use Our Payback Period Calculator Step-by-Step
Our free Payback Period Calculator is simple to use and produces comprehensive results instantly. Here is the complete process for both scenarios:
Step One – Select Your Scenario: Choose between Business Expansion ROI and Equipment Purchase Payback depending on the type of investment you are evaluating.
Step Two – Enter the Investment / Asset Cost: Input the total upfront capital requirement. Be thorough — include all acquisition, installation, and setup costs.
Step Three – Enter Annual Cash Flow / Annual Saving: Input your projected annual net revenue (expansion) or annual cost saving (equipment). Use conservative, evidence-based figures — not best-case projections.
Step Four – Set the Duration: Enter the number of years you want to model. For equipment, use the expected useful life. For expansion, use your planning horizon.
Step Five – Enter Tax Rate and Cost Fields: Input your applicable tax rate and all relevant annual cost deductions — maintenance, repair, and operating costs.
Step Six – Enter Growth / Efficiency Factor: Input the expected annual percentage improvement in cash flows or savings. Even a conservative 3% to 5% growth assumption significantly improves the investment picture over longer horizons.
Step Seven – Click Calculate: Instantly view your seven result metrics — Investment, Gross Annual Cash, Tax Deduction, Maintenance Cost, Net Annual Flow, Payback Period (the Break Even Period Formula result), and Risk/Efficiency factor — along with the year-by-year cash flow table.
Step Eight – Interpret and Adjust: Compare the payback period against your internal benchmarks and adjust inputs to model different scenarios. What if annual savings improve by 10%? What if maintenance costs are higher than expected? The Payback Period Calculator makes these scenario analyses instant.

Limitations of the Break Even Period Formula
The Break Even Period Formula is powerful but not perfect. Understanding its limitations ensures you use it as part of a broader investment analysis framework rather than as the sole decision-making criterion:
Ignores Time Value of Money (Simple Version): As noted, the standard Break Even Period Formula treats all future cash flows equally, ignoring the fact that money received sooner is worth more than money received later.
Ignores Cash Flows After Payback: The Break Even Period Formula focuses entirely on the recovery of initial capital and ignores all value generated after the break-even point. Two investments with the same payback period may have dramatically different total returns over their lifetimes.
Sensitive to Estimation Accuracy: The Break Even Period Formula is only as accurate as the inputs provided. Over-optimistic cash flow projections produce misleadingly short payback periods. Always stress-test the calculation with conservative inputs.
Does Not Measure Profitability: Recovering your investment in 3 years tells you nothing about whether the investment is the best use of capital compared to alternatives. Use the Break Even Period Formula alongside ROI, NPV, or IRR analysis for complete investment evaluation.
Works Best for Shorter Horizons: For long-horizon investments (10+ years), discounted cash flow methods that account for the time value of money provide more accurate decision support.
Frequently Asked Questions (FAQs)
What is the Break Even Period Formula? The Break Even Period Formula calculates how many years it takes for cumulative net cash inflows from an investment to equal the initial capital outlay. The formula is: Payback Period = Initial Investment ÷ Annual Net Cash Flow. Our Payback Period Calculator applies this formula automatically with tax and cost adjustments.
What is a Payback Period Calculator? A Payback Period Calculator is an online tool that automates the Break Even Period Formula across different investment scenarios, incorporating tax rates, maintenance costs, growth factors, and efficiency improvements to produce realistic, after-cost payback period estimates.
Is the Break Even Period Formula the same as payback period? Yes. The Break Even Period Formula and payback period formula refer to the same calculation — the time required for cumulative net cash flows to recover the initial investment. Our Payback Period Calculator applies the Break Even Period Formula to both business expansion and equipment purchase scenarios.
What is a good payback period result from the Break Even Period Formula? This varies by industry and investment type. For most business investments, 2 to 5 years is generally considered strong. Equipment purchases often target payback within the first half of the asset’s useful life.
Does the Break Even Period Formula account for taxes? Our Payback Period Calculator explicitly subtracts tax from gross annual cash flows before applying the Break Even Period Formula — ensuring the payback period reflects after-tax net flows rather than misleadingly high pre-tax figures.
Can I use the Break Even Period Formula for equipment decisions? Yes. The Equipment Purchase Payback scenario in our calculator applies the Break Even Period Formula specifically to asset acquisition decisions, using annual savings, repair costs, operating costs, and efficiency factors as the key inputs.
What is the difference between simple and discounted payback? Simple payback (the standard Break Even Period Formula) does not adjust future cash flows for the time value of money. Discounted payback applies a discount rate to future flows before accumulating them, producing a longer — but more financially accurate — payback estimate for long-horizon investments.
What happens after the Break Even Period Formula payback point is reached? Once the break-even point is reached, all subsequent net cash flows represent pure return above and beyond your recovered capital. The payback table in our calculator shows the balance turning negative after the break-even year — visually confirming the transition from capital recovery to profit generation.
How does growth rate affect the Break Even Period Formula result? A positive annual growth rate in cash flows shortens the effective payback period because later-year cash flows are higher than earlier ones — meaning the investment is recovered faster than a flat-flow calculation would suggest. Our Payback Period Calculator incorporates this dynamic growth effect in the year-by-year table.
Can the Break Even Period Formula handle uneven cash flows? Yes — our Payback Period Calculator applies the cumulative cash flow method when growth or efficiency factors produce uneven annual flows, summing each year’s net cash flow until the balance equals the initial investment.
Conclusion
Every pound, dollar, or euro of business capital deserves to be deployed with precision and purpose. The Break Even Period Formula gives you the analytical foundation to make that happen — transforming investment decisions from gut-feel judgements into evidence-based commitments grounded in real financial projections.
Our free Payback Period Calculator brings the Break Even Period Formula to life across two critical real-world scenarios — Business Expansion ROI and Equipment Purchase Payback — incorporating tax deductions, maintenance costs, growth factors, and efficiency improvements into a seven-metric result summary and a year-by-year cash flow table that shows exactly when your investment recovers its cost and begins generating pure profit.
Whether you are deciding whether to open a new location, purchase a piece of production equipment, invest in technology infrastructure, or commit capital to any significant business initiative, the Break Even Period Formula is the first question you must answer: “When do I get my money back?”
Use our Payback Period Calculator to answer that question accurately, completely, and instantly. Enter your investment details, model your realistic cash flows, account for taxes and costs, and let the Break Even Period Formula reveal the payback timeline that determines whether the opportunity in front of you is worth seizing.
Sound investment decisions start with accurate numbers — and accurate numbers start with the Break Even Period Formula.